Medical Care |

Medical Care

##SEVER##

/a/airccse.org1.html


Microsoft word - 4 paper

Health Informatics- An International Journal (HIIJ) Vol.2, No.4, November 2013 PREDICTIVE COMPARATIVE QSAR ANALYSIS OF AS 5-NITROFURAN-2-YL DERIVATIVES MYCO BACTERIUM TUBERCULOSIS H37RV Doreswamy1 and Chanabasayya .M. Vastrad2 1Department of Computer Science Mangalore University , Mangalagangotri-574 199, Karnataka, 2Department of Computer Science Mangalore University , Mangalagangotri-574 199, Karnataka, Antitubercular activity of 5-nitrofuran-2-yl Derivatives series were subjected to Quantitative Structure Activity Relationship (QSAR) Analysis with an effort to derive and understand a correlation between the biological activity as response variable and different molecular descriptors as independent variables. QSAR models are built using 40 molecular descriptor dataset. Different statistical regression expressions were got using Partial Least Squares (PLS) ,Multiple Linear Regression (MLR) and Principal Component Regression (PCR) techniques. The among these technique, Partial Least Square Regression (PLS) technique has shown very promising result as compared to MLR technique A QSAR model was build by a training set of 30 molecules with correlation coefficient ( ) of 0.8484 , significant cross validated correlation coefficient () is 0.0939,   is 48.5187,  for external test set (  _ ) is -0.5604, coefficient of correlation of predicted data set (  _) is 0.7252 and degree of freedom is 26 by
Partial Least Squares Regression technique.
KEYWORDS

TB, MLR , PLS , PCR , LOO
1. INTRODUCTION
Tuberculosis in humans is generally caused by mycobacterium tuberculosis(TB). The desease is
spread by respirable droplets generated during effective expiratory manoeuvres such as coughing.
TB desease can be either active or latent[1] . The World Health Organization (WHO) asses that
within the next twenty years about thirty million people will be troubled with the bacillus [2-3].
The analytic management of TB has depends dully on a limited number of drugs such as
Isonicotinic acid, Hydrazide,Rifadin, Rimactane ,Myambutol ,Streptomycin, Ethionamide,
Pyrazinamide, Fluroquinolones etc [4]. Still with the origin of these special chemical drugs the
DOI: 10.5121/hiij.2013.2404 47 Health Informatics- An International Journal (HIIJ) Vol.2, No.4, November 2013
spread of TB has not been eradicated completely because of delayed treatment programmes
.There is now recognition that new drugs to treat TB are necessarily required, particularly for use
in shorter medication procedure than are possible with the current agents and which can be
engaged to treat multi-drug resistant and hidden disease[5].
5-nitrofuran-2-yl shows effective in vitro and in vivo antimycobacterial activity [6]. There is also
a great effort to find and develop newer, 5-nitrofuran-2-yl, and some of them might have value in
the remedy of TB [7]. Chemo informatics[26] and computer-aided drug design (CADD) are
likely to contribute to a possible solution for the dangerous situation regarding this infectious
disease by assisting in the swift identification of new effective anti-TB agents. The other way for
overcoming the absence of empirical analysis for biological systems is depends on the activity to
develop quantitative structure activity relationship (QSAR) [8] . QSAR models are mathematical
expressions formulating a relationship between chemical structures and biological activities.
These models have different capability, which is providing a deeper knowledge about the process
of biological activity. In the first step of a usual QSAR study one needs to find a set of molecular
descriptors with the higher influence on the biological activity of interest [9]. A broad scope of
molecular descriptors[10] has been used in QSAR modeling. These molecular descriptors[11]
have been categorised into different classes, including constitutional, geometrical, topological,
quantum chemical and so on. Using such an way one could predict the activities of newly
formulated compounds before a conclusion is being made whether these compounds should be
truly synthesized and tested. We examine the performance of Partial Least Squares(PLS) based
QSAR models with the results produced by Multi Linear Regression(MLR ) and Principal
Component Regression (PCR) methods to discover basic requirements for additional bettered
antitubercular activity.
2. MATERIALS AND METHODS
2.1 MOLECULAR DESCRIPTOR DATA SETS
A set of fourty molecule compounds relates to derivatives for mycobacterium TB(H37Rv)
inhibitors were taken from large antitubercular drug molecule databases[12] using substructure
mining tool Schrodinger Canvas 2010(Trial version) [13]. All molecules were handled by the
Vlife MDS [14] - 2D coordinates of atoms were recalculated counter ions and salts were
eliminated from molecular structures, molecules were neutralized, mesomerized and aromatized.
Data sets were then refined from duplicates. The 2D-QSAR models were produced using a
training set of thirty molecules. Predictive ability of the models was assessed by a test set of ten
molecules with consistently distributed biological activities. The observed selection of test set
molecules was made by seeing the fact that test set molecules shows a range of biological activity
similar to the training set. The actual and predicted biological activities of the training and test
set molecules are given in Table 1.
Health Informatics- An International Journal (HIIJ) Vol.2, No.4, November 2013 Compound
Residual
Health Informatics- An International Journal (HIIJ) Vol.2, No.4, November 2013 Health Informatics- An International Journal (HIIJ) Vol.2, No.4, November 2013 Health Informatics- An International Journal (HIIJ) Vol.2, No.4, November 2013 Table 1 Molecular structure with Observed and Predicted activity of 5-nitrofuran-2-yl used in training and test set using Model-1 (PLS) Expt. = Experimental activity, Pred. = Predicted activity IC50a = Compound concentration in micro mole required to inhibit growth by 50% Health Informatics- An International Journal (HIIJ) Vol.2, No.4, November 2013
PIC50b = -Log (IC50 × 10): Training data set developed using model 1 (PLS) and Test set
is light blue shaded.

2.2 BIOLOGICAL OBSERVED ACTIVITY DATA
For the evolution of QSAR models of 5-nitrofuran-2-yl ,of processes antitubercular activity in
terms of half maximum inhibitory concentration IC50 (µM) versus (H37Rv) strains were took
from the antitubercular drug molecule databases[12]. The IC50 activity data contains only
molecules that have at least exhibited some activity. The biological activity data (IC50) were
transformed in to pIC50 according to the formula pIC50 = (−log (IC50 × 10)) was used as
response values, thus correlating the data linear to the free energy change.
2.3 DESCRIPTOR CALCULATION FOR MOLECULAR DATASET
The VLife MDS tool used for the computation of various molecular descriptors containing
topological index (J), connectivity index (x), radius of gyration (RG), moment of inertia, Wiener
index(W), balabian index(J), centric index, hosoya index (Z), information based indices, XlogP,
logP, hydrophobicity, elemental count, path count, chain count, pathcluster count, molecular
connectivity index (chi), kappa values, electro topological state indices, electrostatic surface
properties, dipole moment, polar surface area(PSA), alignment independent descriptor
(AI)[11,14. The calculated molecular descriptors were gathered in a data matrix. The
preprocessing for the generated molecular descriptors was done by removing invariable (constant
column) and cross-correlated descriptors (with r = 0.99). which happen in total 156, 125 and 162
molecular descriptors for MLR, PCR and PLS accordingly to be used for QSAR analysis.
2.4 CREATION OF TRAINING AND TEST SET
The dataset of forty molecular descriptors is split s into training and test set by Sphere Exclusion (SE)[15-16] technique. In this technique initially data set splits into training and test set using sphere exclusion technique. In this technique variance value provides an idea to handle training and test set size. It needs to be adapted by trial and error until a desired split of training and test set is acquired. Increase in dissimilarity value results in increase in number of molecules in the test set. This technique is used for MLR, PCR and PLS models with pIC50 activity data as response variable and various 2D molecular descriptors computed for the molecules as independent variables. 2.5 MODEL VALIDATION
Model validation [17-18] is a essential manner of quantitative structure–activity relationship (QSAR) modelling. This is done to test the internal stability and predictive capability of the QSAR models. These three QSAR models were validated by the following method. 2.5.1 INTERNAL MODEL VALIDATION
Internal model validation was carried out using leave-one-out (LOO-Q) method. For calculating q, each sample in the training set was eliminated once and the activity of the eliminated sample was predicted by using the model developed by the remaining samples. The Q computed using the expression which explains the internal strength of a model. Health Informatics- An International Journal (HIIJ) Vol.2, No.4, November 2013 !"#  $%&)' (1) ∑($%&  (")*)' In Eq. (1), Y,-./ and Y012 indicate predicted and observed activity values accordingly and Y3.45
signify mean activity value. A model is considered acceptable when the value of Q exceeds 0.5.
2.5.2 EXTERNAL MODEL VALIDATION
External model validation, the activity of each sample in the test set was predicted using the
model created by the training set. The pred_r value is computed as follows.
!"#(9"&9) 9"&9)' ∑(9!):* (")*(9!):*))' In Eq (2) Y,-./(;.2;) and Y;.2; indicate predicted and observed activity values for the test set and
Y;-4<5 indicates mean activity value of the training set. For the predictive QSAR model, the value
of pred_r must be more than 0.5.
2.5.3 RANDOMIZATION TEST
Randomization test or Y-scrambling is key mean of statistical validation. To assess the statistical
importance of the QSAR model for the dataset, one tail hypothesis testing is used. The strength
of the models for training sets was tested by examining these models to those derived for random
datasets. Random sets were produced by rearranging the activities of the samples in the training
set. The statistical model was determined using different randomly reorganize activities (random
sets) with the chosen molecular descriptors and the equivalent Q were computed. The
importance of the models for that reason obtained was developed based on a computed Z2>0-.
A Z score value is calculated by the following equation:

Where ℎ is the Q value computed for the dataset, µ the mean Q, and is its σ standard deviation
calculated for various iterations using models build by different random datasets. The probability
(a) of importance of randomization test is derived by comparing Z2>0-. value with Z2>0-. critical
value as stated, if Z2>0-. value is less than 4.0; otherwise it is computed by the expression as
given in the literature. For example, a Z2>0-. value more than 3.10 proposes that there is a
probability (a) of smaller than 0.001 that the QSAR model build for the dataset is random. The
randomization test proposes that all the created models have a probability of less than 1% that the
model is produced by chance.
2.6 MULTIPLE LINEAR REGRESSION (MLR) ANALYSIS
MLR technique used for modelling linear relationship between a response variable Y (pIC50) and
independent variables X (2D molecular descriptors). MLR is based on least squares technique: the
model is fit such that sum-of-squares of differences of actual and a predicted values are
minimized. MLR estimates the regression coefficients ( r) by applying least squares fitting
Health Informatics- An International Journal (HIIJ) Vol.2, No.4, November 2013 technique. The model builds a relationship in the form of a straight line (linear) that best estimates all the individual data points. In regression analysis, conditional mean of response variable (pIC50) Y depends on (molecular descriptors)X. MLR analysis add to this idea to include more than one independent variables. Regression expression takes the form. where Y is a response variable, ‘b's are regression coefficients for corresponding ‘x's are
molecular descriptors(independent variables), ‘c' is a regression constant or intercept [19,25].
2.7 PRINCIPAL COMPONENT REGRESSION (PCR) ANALYSIS
Principal Component Regression (PCR) is a regression technique that uses principal component
analysis(PCA) when evaluating regression coefficients. PCR presents a technique for finding
structure in datasets. Its object is to group correlated variables, replacing the earlier descriptors
by new set called principal components (PCs). These PC's are uncorrelated and are developed as
a simple linear aggregation of earlier variables. It moves the data into a new set of axes such that
first few axes indicates most of the variations within the data. First PC (PC1) is expressed in the
direction of maximum variance of the whole dataset. Second PC (PC2) is the direction that
defines the maximum variance in orthogonal subspace to PC1. Consequent components are taken
orthogonal to the particular formerly chosen and defines best of remaining variance, by locating
the data on new set of axes, it can points major fundamental structures certainly. Value of each
point, when moved to a given axis, is called the PC value. PCA chooses a new set of axes for the
data. These are chosen in decreasing order of variance within the data. The aim of principal
component PCR is the computation of values of a response variable on the basis of chosen PCs of
independent variables [21].
2.8 PARTIAL LEAST SQUARES (PLS) REGRESSION ANALYSIS
PLS is a well known regression technique which can be used to correlate one or more response
variable (Y) to various independent variables(X) . PLS relates a matrix Y of response variables to
a matrix X of molecular descriptors. PLS is useful in conditions where the number of molecular
descriptors( independent variables) exceeds the number of samples, when X data contain
colinearties or when N is less than 5M, where N is number of samples and M is number of
response variables. PLS builds orthogonal components using existing correlations between
independent variables and corresponding outputs while also keeping most of the variance of
independent variables. Major aim of PLS regression is to predict the activity (Y) from X and to
define their common frame[22,23] . PLS is probably the least contrary of various multivariate
extensions of MLR model. PLS is a technique for constructing predictive models when factors
are many and highly collinear.
2.9 EVALUATION OF THE QSAR MODELS
The created QSAR models are computed using the following statistical parameters: N (Number
of samples in regression); K (Number of independent variables(molecular descriptors)); DF
(Degree of freedom); optimum component ( number of optimums); r ( the squared correlation
coefficient); F test (Fischer's Value) for statistical importance; q (cross-validated correlation
Health Informatics- An International Journal (HIIJ) Vol.2, No.4, November 2013
coefficient); pred_r ( r for external test set); Z2>0-. ( Z score computed by the randomization
test); Best_ran_r (maximal r value in the randomization test) ; Best_ran_q (maximal q value
in the randomization test) ; α ( statistical importance parameter obtained by the randomization
test). The correlation coefficient r is a respective standard of fit by the regression expression. It
expressed the part of the variation in the observed data is analyzed by the regression. Despite, a
QSAR models are examined to be predictive, if the following prerequistes are satisfied: r > 0.6 ,
q > 0.6 and pred_r > 0.5 [24] . The F-test indicates the ratio of variance described by the
model and variance due to the error in the regression. High values of the F-test indicate that
model is statistically meaningful. The reduced standard error of pred_rse , q_se and r_se
demonstrates actual value of the fitness of the model. The cross-correlation extent was set at 0.5.
3. RESULTS
Taining set of 30 and 10 of test set of 5-nitrofuran-2-yl having different substitution were
employed.
3.1 CREATION OF QSAR MODELS
3.1.1 PARTIAL LEAST SQUARES (PLS) REGRESSION ANALYSIS
The molecular descriptors were applied to PLS technique to developQSAR models by using
simulated anealing variable selection mode. PLS model is having following QSAR Eq.(5) with
five descriptors.
pIC50 =
1.8704(StsCcount) + 4.0747(chi5chain) − 0.6865(SaaaCcount) + 0.7046(SssScount) −
0.1538 (SdssCcount) + 4.9478 (5)
Table 2 Statistical parameters of PLS, MLR And PCR Parameters


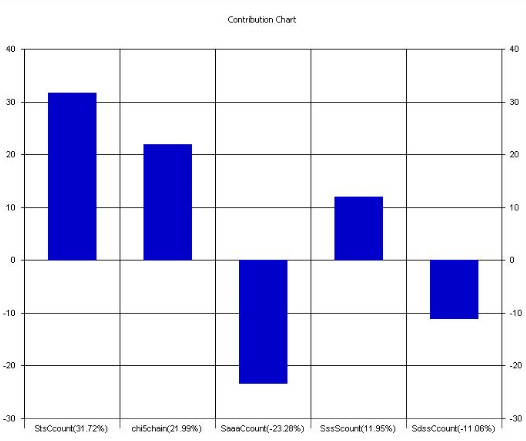
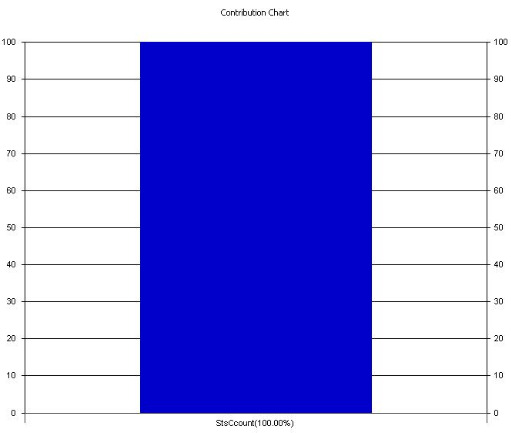
Health Informatics- An International Journal (HIIJ) Vol.2, No.4, November 2013 The above analysis directs to the improvement of statistically meaningful QSAR model, which allows understanding of the molecular properties/features that play an key role in governing the variation in the activities. In addition, this QSAR study allowed examining influence of very simple and easy-to-compute molecular descriptors in discovering biological activities, which could shed light on the important factors that may aid in design of new potent molecules. All the parameters and their significance, which contributed to the specific antitubercular inhibitory activity in the generated model is discussed below. 1. StsCcount: This descriptor indicates the total number of carbon atoms with a triple bond and a
single bond exist in the molecule. Positive Contribution of this descriptor to the model is
31.72%.
2.chi5chain: This descriptor signifies a retention index for five membered ring. Positive
Contribution of this descriptor to the model is 21.99%.
3. SaaaCcount: This descriptor defines the total number of carbon connected with three aromatic
bonds. Negative Contribution of this descriptor to the model is -23.28%.
4. SssScount: This descriptor indicates the total number of sulphur atom attached with two
single bonds. Positive Contributions of this descriptor to the model is 11.95%.
5. SdssCcount: This descriptor defines the total number of carbon connected with one double
and two single bond. Negative Contribution of this descriptor to the model is -11.06%.
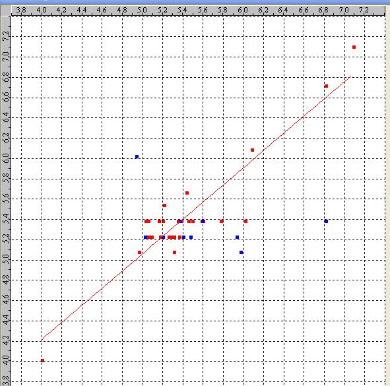
Figure 1 Observed vs. Predicted activities for training and test set molecular descriptors by Partial Least Square model. (A) Training set (Red dots) (B) Test Set (Blue dots). The PLS model gave correlation coefficient ( r) of 0.8484, significant cross validated correlation coefficient ( q) of 0.0939, F-test of 48.5187 and degree of freedom 26. The model is validated by α_ran_r= 0.00100, α_ran_q  = 0.10000, best_ran_r  = 0.56429, best_ran_q = -0.03892, Z 2>0-._-45_- = 3.43122 and Z2>0-._-45_f =1.59111. The randomization test proposes that the created model have a probability of smaller than 1% that the model is build by chance. Statistical


Health Informatics- An International Journal (HIIJ) Vol.2, No.4, November 2013 data is presented in Table 2. The graph of observed vs. predicted activity is demonstrated in Figure 1. The descriptors which contribute for the QSAR model is demonstrated in Figure 2. Figure 2 Percentage contribution of each descriptor in created PLS model describing variation in the 3.1.2 MULTIPLE LINEAR REGRESSION (MLR) ANALYSIS
The QSAR analysis by Multiple Linear Regression method with simulated annealing variable selection technique, the final QSAR model is created having five descriptors is shown in Eq. (6). pIC50 =1.8681(± 0.2421)StsCcount + 4.0722(± 0.7599)chi5chain −0.6879(± 0.1139)SaaaCcount + 0.7033(± 0.2393)SssScount −0.1548 (± 0.0265)SdssCcount + 4.9497 (6) MLR Model has a correlation coefficient ( r ) of 0.8484, significant cross validated correlation coefficient ( q ) of 0.0932, F test of 26.8725 and degree of freedom 24. The model is validated by α_ran_r = 0.00000 , α_ran_q = 0.10000, best_ran_r  = 0.28620, best_ran_q = −0.08598 , Z = 8.11471 andZ2>0-._-45_f = 1.31886 The randomization test proposes that the created model have a probability of smaller than 1% that the model is build by chance. The observed and predicted values with residual values are demonstrated in Table 1.Statistical data is demonstrated in Table 2.The graph of observed vs. predicted activity demonstrated is in Figure 3. The descriptors which contribute for the QSAR model are demonstrated in Figure 4. All the parameters and their significance, which contributed to the specific antitubercular inhibitory activity in the generated models are explained below. Figure 3 Observed vs. Predicted activities for training and test set molecular descriptors from the Multiple Linear Regression model. (A) Training set (Red dots) (B) Test Set (Blue dots).


Health Informatics- An International Journal (HIIJ) Vol.2, No.4, November 2013
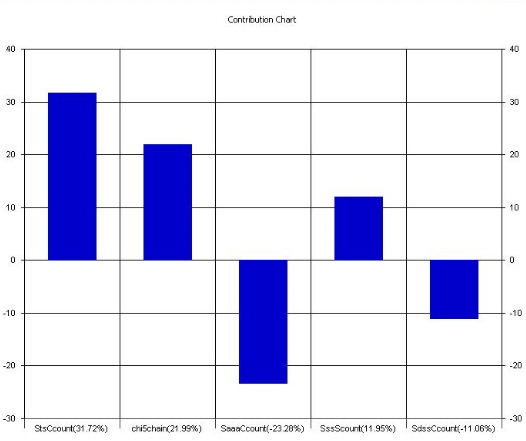
1. StsCcount: This descriptor indicates the total number of carbon atoms with a triple bond and a
single bond present in the molecule. Positive Contribution of this descriptor to the model is
31.67%.
2.chi5chain: This descriptor signifies a retention index for five membered ring. Positive
Contribution of this descriptor to the model is 21.97%.
3. SaaaCcount: This descriptor defines the total number of carbon connected with three aromatic
bonds. Negative Contribution of this descriptor to the model is -23.32%.
4. SssScount: This descriptor indicates the total number of sulphur atom attached with two
single bonds. Positive Contributions of this descriptor to the model is 11.92%.
5. SdssCcount: This descriptor defines the total number of carbon connected with one double
and two single bond. Negative Contribution of this descriptor to the model is -11.12%.
Figure 4 Percentage contribution of each descriptor in created MLR model describing variation in the 3.1.3 PRINCIPAL COMPONENT REGRESSION (PCR) ANALYSIS
The molecular descriptors were applied to under goes PCR technique to create QSAR model with
Simulated anealining variable selection mode by using PCR model. The final QSAR model is
Eq. (7) was created having one descriptor as follows.
pIC50 = 1.7397StsCcount + 5.3563 (7)
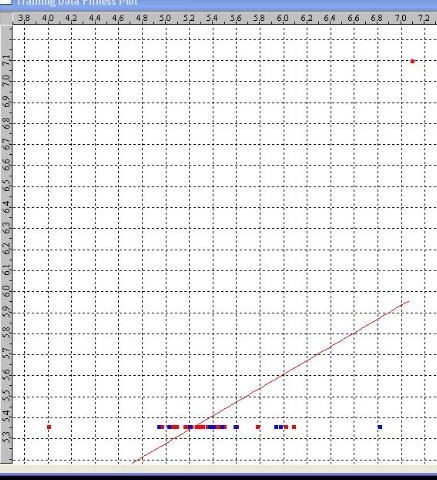
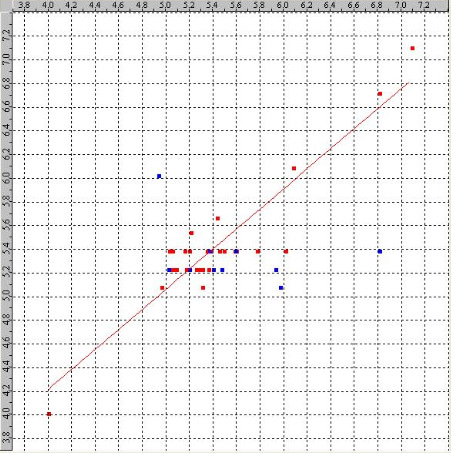
The PCR model gave correlation coefficient ( r) is 0.3289, significant cross validated
correlation coefficient ( q) of -5.3805, F test of 13.7231 and degree of freedom 28. The model is
validated by α_ran_r = 0.01000, α_ran_q  = 99.00000, best_ran_r  = 0.32891, best_ran_q
=-0.13938 , Z
2>0-._-45_- = 2.81258 and Z2>0-._-45_f =-2.47533. The randomization test proposes that the created model have a probability of smaller than 1% that the model is build by chance.


Health Informatics- An International Journal (HIIJ) Vol.2, No.4, November 2013 Statistical data is demonstrated in Table 2. The graph of observed vs. predicted activity is in demonstrated Figure 5 .The descriptors which contribute for the QSAR model is demonstrated in Figure 6. Figure 5 Observed vs. Predicted activities for training and test set molecular descriptors by Principal Component Regression model. A) Training set (Red dots) B) Test Set (Blue dots). All the parameters and their significance, which contributed to the specific antitubercular inhibitory activity in the generated models are discussed here. 1. StsCcount: This descriptor indicates the total number of carbon atoms with a triple bond and a
single bond present in the molecule. Positive Contribution of this descriptor to the model is
100%.
Figure 6 Percentage contribution of each descriptor in developed PCR model describing variation in the Health Informatics- An International Journal (HIIJ) Vol.2, No.4, November 2013
4. CONCLUSION

The 2D QSAR analysis were conducted with a series of 5-nitrofuran-2-yl derivatives for
mycobacterium tuberculosis(H37Rv) inhibitors , and some useful predictive models were
obtained. The physicochemical molecular descriptors were found to have an key role in
governing the change in activity. The statistical parameters demonstrate the estimation power of
QSAR model for the molecular descriptor data set from which it has been determined and
evaluate it only internally. The overall performance of prediction was found to be around 84% in
case of PLS and MLR. Among the three 2D-QSAR models (MLR, PCR, and PLS), the results of
PLS and MLR analysis showed significant predictive power and reliability as compare to PCR
technique.
ACKNOWLEDGEMENTS

The Authors are thankful to Dr Mahesh .B. Palkar Department of Pharmaceutical Chemistry
K.L.E Pharmacy College Hubli
REFERENCES
[1] "Tuberculosis", Centers for Disease Control and Prevention1600 Clifton Rd. Atlanta, GA 30333,
[2] "Weekly Epidemiological Record (WER)",WHO annual report on global TB control – summary [3] Phyllis C. Braun, PhD and John D. Zoidis, MD, "Update on Drug-Resistant Pathogens: Mechanisms of Resistance, Emerging Strains", http://www.rtmagazine.com/issues/articles/2004-01_01.asp [4] "Tuberculosis [5] "Multidrug-resistant [6]T awari NR, Bairwa R, Ray MK, Rajan MG, Degani MS. Bioorg Med Chem Lett. (2010 ),"Design, synthesis,and biological evaluation of 4-(5-nitrofuran-2-yl)prop-2-en-1-one derivatives as potent antitubercular agents." ,1;20(21):6175-8. doi: 10.1016/j.bmcl.2010.08.127. Epub 2010 Sep 16. [7] Sriram D, Yogeeswari P, Dhakla P, Senthilkumar P, Banerjee D, Manjashetty TH (2009),"5- Nitrofuran-2-ylderivatives: synthesis and inhibitory activities against growing and dormant mycobacterium species." , Bioorganic & medicinal chemistry letters 19:4 pg 1152-4 [8] R. Karbakhsh1,* and R. Sabet (2011),"Application of different chemometric tools in QSAR study of azoloadamantanes against influenza A virus", Research in Pharmaceutical Sciences; 6(1): 23-33 [10] "Molecular Descriptors Guide" , Version 1.0.2 Copyright [2008] US Environamental Protection [11] "Streamline https://www.collaborativedrug.com/ ( Accesed in May-june [2012] ) [13] "VlifeMDS", [14] "Sphere Exclusion Method for set selection" ,Rajarshi Guha Penn State University


Health Informatics- An International Journal (HIIJ) Vol.2, No.4, November 2013 [15] Mary Ann Liebert,(1999), "Dissimilarity-Based Algorithms for Selecting Structurally Diverse Sets of Compounds" , JOURNAL OF COMPUTATIONAL BIOLOGY Volume 6, Numbers 3/4, Inc. Pp. 447–457 [16] Tropsha, A.; Gramatica, P.; Gombar,V.K.(2003),"The importance of being earnest: Validation is the absolute essential for successful application and interpretation of QSPR models.", QSAR Comb. Sci. , 22, 69-77 [17] Partha Pratim Roy, Somnath Paul, Indrani Mitra and Kunal Roy(2009) ,"On Two Novel Parameters for Validation of Predictive QSAR Models" , Molecules , 14, 1660-1701 ISSN 1420-3049 [18] "Multile linear Regression", http://www.ltrr.arizona.edu/ dmeko/notes_11.pdf [19] Dr. Frank Dieterle ,"Variable Selection by Simulated Annealing", http://www.frank- [20] Hwang , Dan Nettleton ,"Principal Components Regression With Data-Choosen Components and related methods" , J.T. Gene www.math.cornell.edu/ hwang/pcr.pdf [21] Herv´e Abdi1 ,"Partial Least Squares(PLS) Regression " ,The University of Texas at Dallas [22] Randall D. Tobias, "An introduction to partial least squares Regression", SAS Institute Inc., Carry, NC www.ats.ucla.edu/stat/sas/library/pls.pdf [23] Golbraikh .A , and A. Tropsha, (2002),"Predictive QSAR modeing based on diversity of sampling of experimental datasets for the training and test set selection ", J. Comp Aided . Mol Design , 16:357-366. [24] "Influence of observations on the misclassification probability in quadratic discriminant analysis" [25] Craig A. James, "An introduction to the Computer Science and Chemistry of Chemical Information Systems" eMolecules, Inc. http://www.emolecules.com/doc/cheminformatics-101.php
Authors
Doreswamy
received B.Sc degree in Computer Science and M.Sc Degree in
Computer Science from University of Mysore in 1993 and 1995 respectively. Ph.D
degree in Computer Science from Mangalore University in the year 2007. After
completion of his Post-Graduation Degree, he subsequently joined and served
asLecturer in Computer Science at St. Joseph's College, Bangalore from 1996
1999.Then he has elevated to the position Reader in Computer Science at Mangalor
Universityin year 2003. He was the Chairman of the Department of Post-Graduate Studies and research in
computer science from 2003-2005 and from 2009-2008 and served at varies capacitiesin Mangalore
University at present he is the Chairman of Board of Studies and Professor in Computer Science of
Mangalore University. His areas of Research interests include Data Mining and Knowledge Discovery,
Artificial Intelligence and Expert Systems, Bioinformatics ,Molecular modelling and simulation
,Computational Intelligence ,Nanotechnology, Image Processing and Pattern recognition. He has been
granted a Major Research project entitled "Scientific Knowledge Discovery Systems (SKDS) for
Advanced Engineering Materials Design Applications" from the funding agency University Grant
Commission, New Delhi , India. He has been published about 30 contributed peer reviewed Papers at
national/International Journal and Conferences. He received SHIKSHA RATTAN PURASKAR for his
outstanding achievements in the year 2009 and RASTRIYA VIDYA SARASWATHI AWARD for
outstanding achievement in chosen field of activity in the year 2010.
Chanabasayya.M.Vastrad received B.E. degree and M.Tech. degree in the year
2001and 2006 respectively. Currently working towards his Ph.D Degree in Computer
Scienceand Technology under the guidance of Dr. Doreswamy in the Department of
Post-Graduate Studies and Research in Computer Science , Mangalore University.

Source: http://airccse.org/journal/hiij/papers/2413hiij04.pdf

Fact120

Necrotic Enteritis: Managing without Antibiotics Dr. Linnea J. Newman Schering-Plough Animal Health (presented at the PIC's Poultry Health Conference on November 14, 2000) The medical community has expressed concern that antibiotic use in food animals may promote the development ofantibiotic-resistant strains of bacteria that could threaten the human population. While the true relationship betweenantibiotic use in animals and antibiotic-resistant bacteria in humans has yet to be determined, there has been a strong outcryfrom consumers to eliminate antibiotic use from food animal production.

atherosclerosis-gr.org

C A S E R E P O R T Hellenic Journal of Atherosclerosis 1(1):65–67 Case report of rhabdomyolysis possibly associated to the interaction of ciprofloxacin with simvastatin N. Fountoulakis, L. Khafizova, M. Logothetis, G. Fanti, J.A. Papadakis Department of Internal Medicine, University Hospital of Heraklion, Heraklion Crete, Greece,