Pharmacreations.com
Ashok K A et al / Journal of Pharmacreations Vol-3(1) 2016 [40-63]
Journal of Pharmacreations
Pharmacreations Vol.3 Issue 1 Jan- Mar- 2016
Journal Home page: www.pharmacreations.com
Research article Open Access
New RP HPLC method for the simultaneous estimation of terbutaline
and theophylline in pharmaceutical dosage form
M. Sambasiva Rao, A. Sunil Kumar Reddy, A. Ashok Kumar
Professor & HOD OF Vijaya College of pharmacy, Munaganur (village), Hayathnagar (Mandal ),
Ranga redy (District), Pin-501511.
*Corresponding author: A. Ashok Kumar
Email: [email protected]
ABSTRACT
A simple and selective LC method is described for the determination of Terbutaline and Theophylline dosage forms.
Chromatographic separation was achieved on a c18 column using mobile phase consisting of a mixture of 20Mm
Phosphate buffer (KH2PO4) pH: 3.5 Acetonitrile (80:20v/v/v), with detection of 250 nm. Linearity was observed in
the range 1.25-3.75 µg /ml for Terbutaline (r2 =0.9975) and 50-150/ml for Theophylline (r2 =0.9994) for the amount
of drugs estimated by the proposed methods was in good agreement with the label claim. The proposed methods
were validated. The accuracy of the methods was assessed by recovery studies at three different levels. Recovery
experiments indicated the absence of interference from commonly encountered pharmaceutical additives. The
method was found to be precise as indicated by the repeatability analysis, showing %RSD less than 2. All statistical
data proves validity of the methods and can be used for routine analysis of pharmaceutical dosage form.
Key words: Phosphate buffer (KH2PO4) pH: 3.5 Acetonitrile (80:20v/v/v), Terbutaline and Theophylline
Types of HPLC
High Performance Liquid Chromatography is
the most widely used of all the analytical
HPLC is classified into various types
separation techniques. The reasons for its
Based on polarity of stationary and mobile
popularity are its sensitivity, ready adaptability to
quantitative determination, suitable for non- volatile and thermally fragile species, wide
Normal Phase Chromatography
applicability to variety of substances such as
Reverse Phase Chromatography
Based on the principle of separation
proteins, hydrocarbons, terpenoids, pesticides,
steroids, metal-organic species and inorganic
Adsorption Chromatography
species. As high pressures (around 3000 psi) are
Partition Chromatography
used for the separation of the analytes down the
Ion Pair Chromatography
column, it is often termed as High Pressure Liquid
Size Exclusion Chromatography
Chromatography.
4, 5, 6
Chiral Phase Chromatography
Ashok K A et al / Journal of Pharmacreations Vol-3(1) 2016 [40-63]
Based on elution technique
Wavelength
Isocratic Elution
Gradient Elution
In simultaneous estimation of two drugs
isobestic wavelength is used. Isobestic point is the
Based on scale of operation
wavelength where the molar absorptivity is the
same for two substances that are interconvertible.
Preparative HPLC
So this wavelength is used in simultaneous
Based on the polarity of the stationary phase and
estimation to estimate both drugs accurately.
the mobile phase, it is of two types:
Preparation of standard stock solution of
Normal Phase (NP) HPLC
TERBUTALINE
In this type, the stationary phase is polar and
50 mg of Terbutaline was weighed and
the mobile phase is non-polar, polar compounds
transferred in to 500ml volumetric flask and
are retained for a longer periods because of more
dissolved in methanol and then make up to the
affinity towards the stationary phase, hence non-
mark with methanol and prepare 10 µg /ml of
polar compounds travel faster and are eluted first.
solution by diluting 1ml to 10ml with methanol.
Reverse Phase (RP) HPLC
Preparation of standard stock solution
ofTHEOPHYLLINE
In this type, the stationary phase is non-polar
and the mobile phase is polar, non-polar
50mg of Theophylline was weighed in to 500ml
compounds are retained for longer periods as they
volumetric flask and dissolved in Methanol and
have more affinity towards the stationary phase.
then dilute up to the mark with methanol and
Hence, polar compounds travel faster and are
prepare 10 µg /ml of solution by diluting 1ml to
eluted first.
3, 4,5,6
10ml with methanol.
AIM AND PLAN OF WORK
RESULTS AND DISCUSSION
Solubility Studies
To develop new RP HPLC method for the
These studies are carried out at 25 0 C
simultaneous estimation of TERBUTALINE &
Terbutaline
THEOPHYLLINE in pharmaceutical dosage form.
Soluble in methanol, sparingly soluble in DMSO,
Plan of work
insoluble in Water,.
Solubility determination of Terbutaline &
Theophylline in various solvents and buffers.
Freely Soluble in Methanol. Slightly Soluble in
Determine the absorption maxima of the drug in
UV–Visible region in different solvents/buffers and selecting the solvents for HPLC method
Wavelength determination
The wavelength of maximum absorption (λ
Optimize the mobile phase and flow rates for
of the drug, 10 μg/ml solution of the drugs in
proper resolution and retention times.
Validate the developed method as per ICH
spectrophotometer within the wavelength region of
200–400 nm against methanol as blank. The
resulting spectra are shown in the fig. no. 1, 2 and
METHODOLOGY
3 and the absorption curve shows characteristic
Mobile Phase
absorption maxima at 241 nm for Terbutaline and
A mixture of 80 volumes of Phosphate buffer
Theophylline 278 and 250 nm for the combination.
pH 3.5:20volumes of Acetonitrile. The mobile phase was sonicated for 10min to remove gases.
Ashok K A et al / Journal of Pharmacreations Vol-3(1) 2016 [40-63]
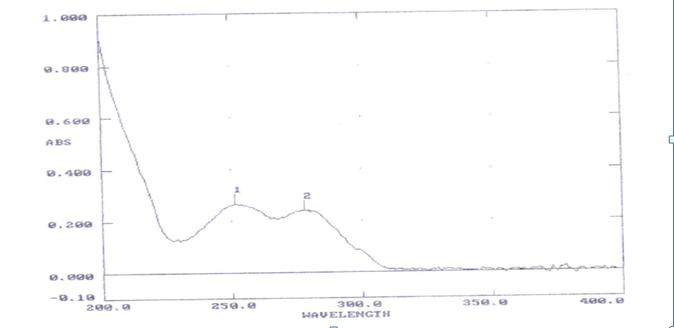
Fig. 1: UV-VIS spectrum of terbutaline
λmax was found to be 241 nm for Terbutaline shown in the figure 1
Fig. 2: UV-VIS spectrum of Theophylline
Observation
λmax was found to be 278 nm for Theophylline shown in the figure 2
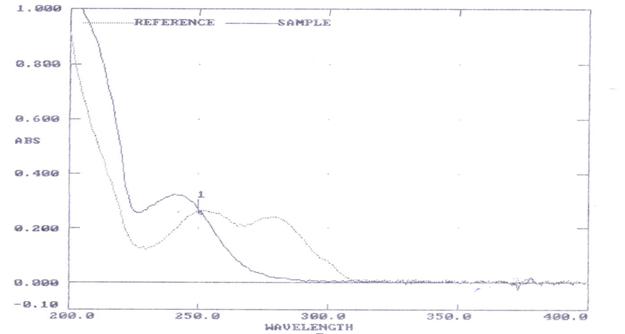
Fig. 3: UV-VIS spectrum of Terbutaline and Theophylline and the isosbestic point was 250 nm
Ashok K A et al / Journal of Pharmacreations Vol-3(1) 2016 [40-63]
Observation
and dissolve in 10ml of mobile phase and make up the volume with mobile phase From above stock
The Isosbestic point was found to be 250nm for
solution 2.5 µg/ml of Terbutaline and 100 µg/ml of
Terbutaline and Theophylline in combination and
Theophylline is prepared by diluting 1ml to 10ml
was shown in figure 3
with mobile phase. This solution is used for
recording chromatogram.
DEVELOPMENT
TERBUTALINE & THEOPHYLLINE
Trial- 4
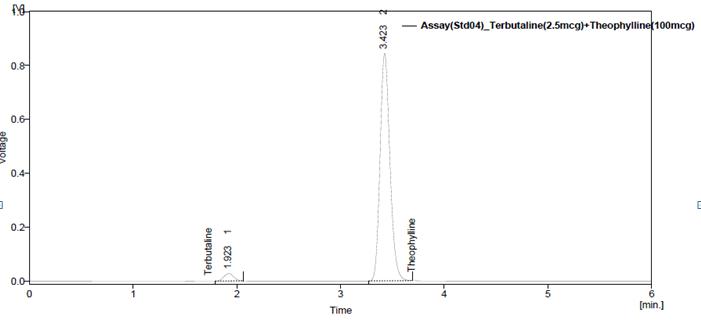
Preparation of mixed standard solution
weigh accurately 2.5mg of Terbutaline and 100
mg of Theophylline in 100 ml of volumetric flask
Fig. 4: Chromatogram of terbutaline and theophylline by using mobile phase.
Ashok K A et al / Journal of Pharmacreations Vol-3(1) 2016 [40-63]
Observation
The peaks showed more efficiency and more resolution. Hence this method was optimised.
Table 1: Optimized chromatographic conditions
Mobile phase
Phosphate buffer (KH2PO4) pH: 3.5 Acetonitrile (80:20v/v/v),
INERTSIL column,C18(150x4.6 ID) 5µm
Column temperature Room temperature(20-25oC) Sample temperature
Room temperature(20-25oC)
Injection volume
About 2.337 min for Terbutaline and 4.028min for Theophylline
weighed and taken into a mortar and crushed to
Preparation of samples for Assay
fine powder and uniformly mixed. Tablet stock solutions
Preparation of mixed standard solution
Theophylline (1000μg/ml) were prepared by
Weigh accurately 2.5mg of Terbutaline and 100
mg of Theophylline in 100 ml of volumetric flask
Terbutaline and 100 mg of Theophylline and
and dissolve in 10ml of mobile phase and make up
dissolved in sufficient mobile phase. After that
the volume with mobile phase From above stock
filtered the solution using 0.45-micron syringe
solution 2.5 µg/ml of Terbutaline and 100 µg/ml of
filter and Sonicated for 5 min and dilute to 100ml
Theophylline is prepared by diluting 1ml to 10ml
with mobile phase. Further dilutions are prepared
with mobile phase. This solution is used for
in 5 replicates of 2.5μg/ml of Terbutaline and 100
recording chromatogram.
μg/ml of Theophylline was made by adding 1ml of stock solution to 10 ml of mobile phase.
Preparation of sample solution
5tablets (each tablet contains 2.5mg of
Terbutaline and 100mg of Theophylline) were
Fig. 5: Chromatogram of Assay standard preparation-1
Ashok K A et al / Journal of Pharmacreations Vol-3(1) 2016 [40-63]
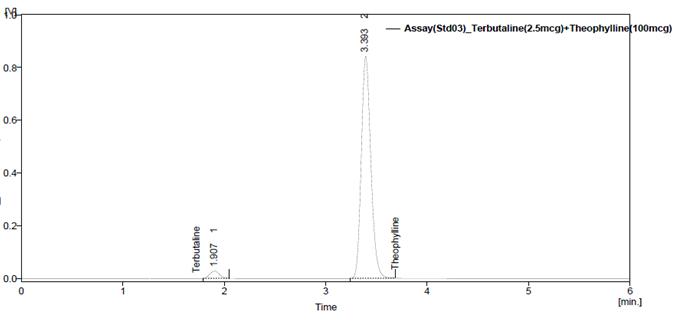
Fig. 6: Chromatogram of Assay standard preparation-2
Fig. 7: Chromatogram of Assay standard preparation-3
Fig. 8: Chromatogram of Assay standard preparation-4
Ashok K A et al / Journal of Pharmacreations Vol-3(1) 2016 [40-63]
Fig. 9: Chromatogram of Assay standard preparation-5
Fig. 10: Chromatogram of Assay sample preparation-1
Fig. 11: Chromatogram of Assay sample preparation-2
Ashok K A et al / Journal of Pharmacreations Vol-3(1) 2016 [40-63]
Fig. 12: Chromatogram of Assay sample preparation-3
Fig. 13: Chromatogram of Assay sample preparation-4
Fig. 14: Chromatogram of Assay sample preparation-5
Table No.2: Assay Results
TERBUTALINE
Standard Area Sample Area Standard Area Sample Area
Injection-1
Ashok K A et al / Journal of Pharmacreations Vol-3(1) 2016 [40-63]
Injection-2
Injection-3
Injection-4
Injection-5
Average Area
Tablet average weight 150.75mg
Standard weight
Sample weight
Label amount
std. purity
Amount found in mg
Observation
Preparation of sample solution
The amount of Terbutaline and Theophylline
5tablets (each tablet contains 2.5mg of Terbutaline
present in the taken dosage form was found to be
and 100mg of Theophylline) were weighed and
99.60 and 99.03% respectively.
taken into a mortar and crushed to fine powder and
VALIDATIONS
Terbutaline (25μg/ml) and Theophylline (1000μg/ml)
Specificity by Direct comparison method
were prepared by dissolving weight equivalent to
There is no interference of mobile phase, solvent
2.5mg of Terbutaline and 100 mg of Theophylline
and placebo with the analyte peak and also the peak
and dissolved in sufficient mobile phase. After that
purity of analyte peak which indicate that the method
filtered the solution using 0.45-micron syringe filter
is specific for the analysis of analytes in their dosage
and Sonicated for 5 min and dilute to 100ml with
mobile phase. Further dilutions are prepared in 5 replicates of 2.5μg/ml of Terbutaline and 100 μg/ml
Preparation of samples for Assay
of Theophylline was made by adding 1ml of stock
Preparation of mixed standard solution
solution to 10 ml of mobile phase.
2.5 µg/ml of Terbutaline and 100 µg/ml of Theophylline solution is prepared with mobile phase. This solution is used for recording chromatogram.
Fig. 15: Blank chromatogram for specificity by using mobile phase
Ashok K A et al / Journal of Pharmacreations Vol-3(1) 2016 [40-63]
Fig. 16: Chromatogram for specificity of Terbutaline & Theophylline sample
Fig. 17: Chromatogram for Specificity of Terbutaline & Theophylline standard
Observation
Linearity and range
It is observed from the above data, diluent or
Preparation of mixed standard solution
excipient peaks are not interfering with the Terbutaline & Theophylline peaks.
Weigh accurately 2.5 mg of Terbutaline and
100 mg of Theophylline in 100 ml of volumetric flask and dissolve in 10ml of mobile phase and make up the volume with mobile phase. Further take 1ml into 10ml volumetric flask and make upto 10ml with mobile phase.
Table 3: Linearity Preparations
Volume from standard stock Volume made up in ml
Concentration of solution(µg
transferred in ml
(with mobile phase)
/ml)
Terbutaline
Ashok K A et al / Journal of Pharmacreations Vol-3(1) 2016 [40-63]
Preparation 1
Preparation 2
Preparation 3
Preparation 4
Preparation 5
Fig. 18: Chromatogram of Terbutaline and Theophylline preparation-1
Fig. 19: Chromatogram of Terbutaline and Theophylline preparation-2
Fig. 20: Chromatogram of Terbutaline and Theophylline preparation-3
Ashok K A et al / Journal of Pharmacreations Vol-3(1) 2016 [40-63]
Fig.21: Chromatogram of Terbutaline and Theophylline preparation-4
Fig. 22: Chromatogram of Terbutaline and Theophylline for preparation -5
Table 4: linearity of Terbutaline
S.No. Conc.(µg/ml ) Area
1
Table 9.3.8: linearity of THIOCOLCHICOSIDE
S.No. Conc.(µg/ml ) Area
1
Ashok K A et al / Journal of Pharmacreations Vol-3(1) 2016 [40-63]
Linearity of Theophylline
y = 27.805x + 20.597
Linearity of Terbutaline
y = 55.753x + 13.343
Fig. 23: Linearity graph of Terbutaline And Theophylline
Observation
ACCURACY
Accuracy of the method was determined by
The correlation coefficient for linear curve
Recovery studies. To the formulation (pre analyzed
obtained between concentration vs. Area for
sample), the reference standards of the drugs were
added at the level of 75%, 100%, 125%. The
Theophylline is 0.998 and 0.999. The relationship
recovery studies were carried out three times and the
between the concentration of Terbutaline and
percentage recovery and percentage mean recovery
Theophylline and area of Terbutaline and
were calculated for drug is shown in table. To check
Theophylline is linear in the range examined since
the accuracy of the method, recovery studies were
all points lie in a straight line and the correlation
carried out by addition of standard drug solution to
coefficient is well within limits.
pre-analyzed sample solution at three different levels
75%, 100% & 125%.
Fig. 24: Chromatogram of 75%recovery (injection 1)
Ashok K A et al / Journal of Pharmacreations Vol-3(1) 2016 [40-63]
Fig. 25: Chromatogram of 75% recovery (injection 2)
Fig. 26: Chromatogram of 75% recovery (injection 3)
Fig. 27: Chromatogram of 100% recovery (injection 1)
Ashok K A et al / Journal of Pharmacreations Vol-3(1) 2016 [40-63]
Fig. 28: Chromatogram of 100% recovery (injection 2)
Fig.29: Chromatogram of 100% recovery (injection 3)
Fig. 30: Chromatogram of 125% recovery(injection 1)
Ashok K A et al / Journal of Pharmacreations Vol-3(1) 2016 [40-63]
Fig. 31: Chromatogram of 125% recovery (injection 2)
Fig. 32: Chromatogram of 125% recovery (injection 3)
Acceptance criteria
The % recovery of Terbutaline and Theophylline should lie between 98% and 102%.
Table 5 : Recovery results for Terbutaline
Accuracy Terbutaline
%Recovery Recovery
recovered(mcg/ml)
Ashok K A et al / Journal of Pharmacreations Vol-3(1) 2016 [40-63]
Table 6 : Recovery results for Theophylline
Accuracy Theophylline
%Recovery Recovery
recovered(mcg/ml)
4982.116 5042.760
5944.656 5944.582
Observation
Acceptance criteria
The percentage mean recovery of Terbutaline
The % Relative standard deviation of Assay
preparations of Terbutaline and Theophylline should
be not more than 2.0%.
PRECISION
Method precision
Prepared sample preparations of Terbutaline and Theophylline as per test method and injected 6 times in to the column.
Fig. 33: Chromatogram of precision injection 1
Ashok K A et al / Journal of Pharmacreations Vol-3(1) 2016 [40-63]
Fig. 34: Chromatogram of precision injection 2
Fig. 35: Chromatogram of precision injection 3
Fig. 36: Chromatogram of precision injection 4
Ashok K A et al / Journal of Pharmacreations Vol-3(1) 2016 [40-63]
Fig. 37: Chromatogram of precision injection 5
Fig. 38: Chromatogram of precision injection 6
Table 7: Results for Method precision of Terbutaline and Theophylline
1.9322 181.915 avg
%RSD 1.70
%RSD 1.96
Ashok K A et al / Journal of Pharmacreations Vol-3(1) 2016 [40-63]
Observation
different variable conditions like using different conditions like Temperature and wavelength.
Test results for Terbutaline and Theophylline are
System suitability parameters were compared with
showing that the %RSD of Assay results are within
that of method precision.
limits. The results were shown in table Table 7.
Acceptance criteria
ROBUSTNESS
The system suitability should pass as per the
Chromatographic conditions variation
test method at variable conditions.
To demonstrate the robustness of the method,
prepared solution as per test method and injected at
Fig. 39: Chromatogram of Terbutaline and Theophylline Robustness (0.8 ml/min)
Fig. 40: Chromatogram of Terbutaline and Theophylline for Robustness (1.2 ml/min)
Ashok K A et al / Journal of Pharmacreations Vol-3(1) 2016 [40-63]
Fig. 41: Chromatogram of Terbutaline and Theophylline for Robustness (249nm)
Fig. 42: Chromatogram of Terbutaline and Theophylline for Robustness (250nm)
Fig. 43: Chromatogram of Terbutaline and Theophylline for Robustness (251nm
Ashok K A et al / Journal of Pharmacreations Vol-3(1) 2016 [40-63]
Table 8: Result of Robustness study
Terbutaline
Parameter
Retention time(min) Tailing factor Retention time(min) Tailing factor
0.8ml/min
1.0 ml/min
1.2ml/min
Wavelength
Observation
RUGGEDNESS
The ruggedness of the method was studied by
From the observation it was found that the
the determining the analyst to analyst variation by
system suitability parameters were within limit at
performing the Assay by two different analysts
all variable conditions.
Acceptance criteria
The % Relative standard deviation of Assay values between two analysts should be not more than 2.0%.
Fig. 44: Chromatogram of Analyst 01 standard preparation
Ashok K A et al / Journal of Pharmacreations Vol-3(1) 2016 [40-63]
Fig. 45: Chromatogram of Analyst 01 sample preparation
Fig. 46: Chromatogram of Analyst 02 standard preparation
Fig. 47: Chromatogram of Analyst 02 sample preparation
Ashok K A et al / Journal of Pharmacreations Vol-3(1) 2016 [40-63]
Table 9: Results for Ruggedness
Terbutaline %Assay Theophylline %Assay
Analyst 01
Analyst 02
Observation
of Terbutaline and Theophylline was found to be simple, precise, accurate and high resolution and
From the observation the %RSD between two
shorter retention time makes this method more
analysts Assay values not greater than 2.0%, hence
acceptable and cost effective and it can be
the method was rugged.
effectively applied for routine analysis in research
CONCLUSION
industries, approved testing laboratories, bio-
From the above experimental results and
pharmaceutical and bio-equivalence studies and in
parameters it was concluded that, this newly
clinical pharmacokinetic studies in near future.
developed method for the simultaneous estimation
BIBLIOGRAPHY
[1]. The Drugs and Cosmetics Act and Rules, 1940.
[2]. Methods of Analysis-
[3]. Douglas, A.; Skoog, F.; James, H.; Stanley, R. C. Liquid Chromatography. In Instrumental Analysis, 9th ed.;
Cengage Learning India Pvt. Ltd.: New Delhi, 2007; 893 - 934.
[4]. Skoog; Holler; Crouch; Liquid Chromatography. In Instrumental Analysis, Cengage Learning India.:New
Delhi. 2011; 893.
[5]. Chatwal, R. G.; Anand, K. S. High Performance Liquid Chromatography. In Instrumental Methods Of
Chemical Analysis, 5th ed.; Himalaya Publishers.:Mumbai, 2010; 2.570 - 2.629.
[6]. Sharma, B. K. High Performance Liquid Chromatography. In Instrumental Methods Of Chemical Analysis,
24th ed.; Goel Publishers.: Meerut, 2005; 295 - 300.
[7]. Alfonso, R. G.; Ara, H. D. M.; Glen, R. H.; Thomas, M.; Nicholas, G. P.; Roger, L.S.; Steve, H. W.
Chromatography. In Remington: The Science and Practice of Pharmacy, 20th ed.; Lippincott Williams & Wilkins: Philadelphia, 2000; 587
[8]. Adsorption Chromatography- http://www.separationprocesses.com/Adsorption/AD_Chp05a.htm [9]. Adsorption Chromatography- http://cemca.org/andcollege/andcwebsite/subject01/CHEtext.pdf [10]. Types of Chromatography- http://www.separationprocesses.com/Adsorption/AD_Chp05a.htm [11]. Partition Chromatography –
[12]. Ion Exchange Chromatography-
[13]. Ion Exchange Chromatography-
Source: http://www.pharmacreations.com/user/download/76/JPC_16-106_40-63.pdf
AstaPure® – the sustainable antioxidantCreate dietary supplements that appeal to ethical consumers © 2016 Algatechnologies. All rights reserved. Ethical supplements take centre-stageSustainability has been a key trend in the food and beverage sector for the past decade, and promises to be a major factor for many years to come. Increasingly the dietary supplements
Ramset Chemset Injection Reo 502 ITW Australia Pty Ltd (Ramset) Chemwatch Hazard Alert Code: Issue Date: 09/09/2015 Version No: 3.1.1.1 Print Date: 09/09/2015 Material Safety Data Sheet according to NOHSC and ADG requirements Initial Date: Not Available SECTION 1 IDENTIFICATION OF THE SUBSTANCE / MIXTURE AND OF THE COMPANY / UNDERTAKING