Tdi.dartmouth.edu
Annals of Internal Medicine
The Effectiveness of a Primer to Help People Understand Risk
Two Randomized Trials in Distinct Populations
Steven Woloshin, MD, MS; Lisa M. Schwartz, MD, MS; and H. Gilbert Welch, MD, MPH
Background: People need basic data interpretation skills to under-
point validated scores (interest and confidence in interpreting med-
stand health risks and to weigh the harms and benefits of actions
ical statistics) and participants' ratings of the booklet's usefulness.
meant to reduce those risks. Although many studies documentproblems with understanding risk information, few assess ways to
Results: In the high SES trial, 74% of participants in the primer
teach interpretation skills.
group received a "passing grade" on the medical data interpreta-tion test versus 56% in the control group (
P ⫽ 0.001). Mean scores
Objective: To see whether a general education primer improves
were 81 and 75, respectively (
P ⫽ 0.0006). In the low SES trial,
patients' medical data interpretation skills.
44% versus 26% "passed" (
P ⫽ 0.010): Mean scores were 69 and62 in the primer and control groups, respectively (
P ⫽ 0.008). The
Design: Two randomized, controlled trials done in populations with
primer also significantly increased interest in medical statistics by 6
high and low socioeconomic status (SES).
points in the high SES trial (a 4-point increase vs. a 2-point decrease
Setting: The high SES trial included persons who attended a public
from baseline) (
P ⫽ 0.004) and by 8 points in the low SES trial (a
lecture series at Dartmouth Medical School, Hanover, New Hamp-
6-point increase vs. a 2-point decrease from baseline) (
P ⫽ 0.004)
shire; and the low SES trial included veterans and their families from
compared with the control booklet. The primer, however, did not
the waiting areas at the White River Junction Veterans Affairs
improve participants' confidence in interpreting medical statistics
Medical Center, White River Junction, Vermont.
beyond the control booklet (a 2-point vs. a 4-point increase in thehigh SES trial [
P ⫽ 0.36] and a 2-point versus a 6-point increase in
Participants: 334 adults in the high SES trial and 221 veterans and
the low SES trial [
P ⫽ 0.166]). The primer was rated highly: 91% of
their families in the low SES trial were enrolled from October 2004
participants in the high SES trial found it "helpful" or "very help-
to August 2005. Completion rates for the primer and control
ful," as did 95% of participants in the low SES trial.
groups in each trial were 95% versus 98% (high SES) and 85%versus 96% (low SES).
Limitations: The primarily male low SES sample and the primarily
female high SES sample limits generalizability. The authors did not
Intervention: The intervention in the primer groups was an edu-
assess whether better data interpretation skills improved decision-
cational booklet specifically developed to teach people the skills
needed to understand risk. The control groups received a generalhealth booklet developed by the U.S. Department of Health and
Conclusion: The primer improved medical data interpretation skills
Human Services Agency for Health Care Research and Quality.
in people with high and low SES.
Measurements: Score on a medical data interpretation test, a pre-
Ann Intern Med. 2007;146:256-265.
viously validated 100-point scale, in which 75 points or more is
For author affiliations, see end of text.
considered "passing." Secondary outcomes included 2 other 100-
ClinicalTrials.gov registration number: NCT00380432.
People face a bewildering array of medical decisions (for the risk for a particular condition compare with other im-
example, should I be tested for BRCA1? Should I be
portant health risks?). Third, people need to be able to
screened for prostate cancer? Should I have lumpectomy
make some basic assessment about the quality of the evi-
and radiation to treat my breast cancer?). If people are to
dence to know whether they can believe the numbers that
make informed decisions, they need to understand risk:
they are given.
What is my chance of staying healthy if I undergo this
Anecdotal experience and a growing body of literature
intervention? What is my chance of staying healthy if I
document the trouble many people have in making sense
forgo it? What is the chance of harm?
of risk information (1– 4), which is now ubiquitous in
Understanding risk data entails a set of skills. First,
health messages. This is not surprising: Much more effort
people must be able to work with probabilities and changes
goes into disseminating health information (for example,
in probabilities, the typical measures used to communicate
drug advertisements, media reports, and decision-making
risk information. Next, they need to have a framework on
aids) than into preparing the target audiences to under-
which to organize data. In essence, this means having asense of what additional information is needed to givemeaning to a statement about probability (conversely, how
to know when such additional information is lacking). For
example, putting a particular risk in context ("your chance
of breast cancer is 1 in 8") entails knowing what outcomeis being considered (diagnosis vs. death), being clear about
the time period (5 years vs. lifetime), and having some
Conversion of figures and tables into slides
perspective on the magnitude of the probability (How does
256 20 February 2007 Annals of Internal Medicine Volume 146 • Number 4
Testing a Primer on Risk Article
stand it. To address this gap, we developed a primer tohelp people develop the basic skills needed to make sense
of the medical risk data that surround them. In this paper,
Educational materials aimed at improving people's ability
we report on 2 randomized trials that tested the primer.
to understand information about risk are scarce.
We sought to learn how people would respond to the
primer: Would they read it? Would they value this knowl-edge? Most important, would the primer improve patients'
In 2 trials, adults with high or low socioeconomic status
abilities to interpret medical data?
(SES) were randomly assigned to receive a primer aboutunderstanding risk or a general health booklet. In both SES
groups, adults receiving the primer more often passed a
medical data interpretation test than did those receivingthe general health booklet. They also expressed greater
To test the effect of the primer on how well people
interest in medical statistics but not greater confidence in
understand risk, we conducted 2 randomized trials in dis-
interpreting statistics, and most rated the primer helpful or
tinct populations: people with high and low socioeconomic
very helpful.
status (SES).
Figure 1 shows an overview of the study de-
sign. The Committee for the Protection of Human Sub-
jects at Dartmouth College approved this project, and the
The authors did not examine whether improved data in-
survey cover letter was considered to be informed consent
terpretation skills affected decision-making.
(signed consent was waived).
Setting and Participants
—The Editors
We calculated our sample size under the most conser-
vative conditions—when the pooled proportion of passingscores was 50%. We asserted that a 20-percentage point
erans Affairs (VA) Medical Center, White River Junction,
absolute difference in the proportion passing the test in the
Vermont, by posting study advertisements in waiting areas
primer group versus the control group would be clinically
of the outpatient clinic. A total of 221 people who re-
important. In calculating the sample size requirements, we
sponded to the advertisement were eligible (that is, they
therefore assumed that the proportion passing would be
met the age criteria of 35 to 79 years, spoke English, and
50% in the control group and 70% in the primer group.
were a veteran or the family member of a veteran who was
When a power of 0.8 and a 2-sided
P value of 0.05 were
enrolled in a VA clinic) and were subsequently randomly
used, 100 patients were required for each study group.
assigned. Ninety percent (
n ⫽ 200) returned completed
Assuming that 10% of participants would be lost to follow-
surveys (completion rates were significantly lower in the
up, we planned to enroll 110 patients per group in each trial.
primer group than in the control group [85% vs. 96%,respectively]) (
P ⫽ 0.005).
High Socioeconomic Status Trial
Randomization and Interventions
To study the effect of the primer in a highly educated
The letter and the advertisement asked people to par-
and affluent group, we recruited alumni from Dartmouth's
ticipate in a research study to learn how to better give
"Community Medical School." This 9-lecture series on
people health information. We did not mention our inter-
various health and medical topics is taught by Dartmouth
est in enhancing quantitative skills. People who responded
faculty and guests; is held annually in Hanover, New
to the recruitment letter (high SES group) or to the adver-
Hampshire, and Manchester, New Hampshire; and has a
tisement (low SES group) were first interviewed to confirm
$25 registration fee (5). For this study, the program orga-
eligibility. We only accepted 1 participant per household.
nizers mailed recruitment letters to 1138 "alumni." A total
Within each trial, we assigned participants on an individ-
of 334 people who responded to the letter were eligible
ual basis to receive either the primer or control booklet. A
(that is, they met the age criterion of 35 to 79 years, spoke
list of random numbers (created by using a random-num-
English, and had attended the Community Medical School
ber generator) was given to a research assistant and was
in the past) and were subsequently randomly assigned.
used to determine assignments (randomization was not
Ninety-six percent (
n ⫽ 322) returned a completed survey
stratified or blocked within each trial). The research assis-
(completion rates were not significantly different between
tant had access to participants' characteristics. The investi-
the primer and control groups [95% vs. 98%, respec-
gators did not have access to the assignment list, and the
tively]) (
P ⫽ 0.192).
deidentified code was only revealed after recruitment andcompletion of data collection.
Low Socioeconomic Status Trial
The appropriate booklet and a survey were mailed or
To study the effect of the primer in a sample with
given in person to participants. The survey included the
lower income and less formal education, we recruited vet-
major outcomes that will be described in the next section.
erans and their families at the White River Junction Vet-
To make the survey seem relevant to the control group, it
20 February 2007 Annals of Internal Medicine Volume 146 • Number 4
257
Article Testing a Primer on Risk
Figure 1. Overview of 2 randomized trials in distinct populations.
SES ⫽ socioeconomic status; VA ⫽ Veterans Affairs.
also included additional questions about facts presented in
harms of interventions by using a Zocor direct-to-con-
the health booklet (we did not analyze responses to these
sumer advertisement for secondary heart disease preven-
questions). All participants were asked to read the booklet
tion.
Figure 2 shows the summary of main concepts that
and return the completed survey within 2 weeks using the
were taught, which is excerpted from the booklet. The
self-addressed stamped envelope included with the survey.
contents of the primer and many of the examples have
Reminder letters were sent to nonresponders. Participants
been developed and revised over years of teaching and
who returned surveys were given their choice of a $25 gift
through focus groups with people across a diverse socioeco-
certificate to a local bakery, restaurant, bookstore, or large
nomic spectrum.
retail store. We recruited participants from October 2004
Because many people are intimidated by numbers and
through August 2005.
statistics, we worked hard to make the primer inviting and
Primer Group
nonthreatening by liberal use of cartoons and figures; by
The participants in the primer group received the
working through examples, separating the most technical
booklet entitled "Know Your Chances: Understanding
material into optional "learn more boxes"; and by provid-
Health Statistics." The goal of the primer is to teach people
ing readers with quizzes (with answers) to assess their mas-
how to understand risk messages and health statistics. The
tery of the material as they read the primer.
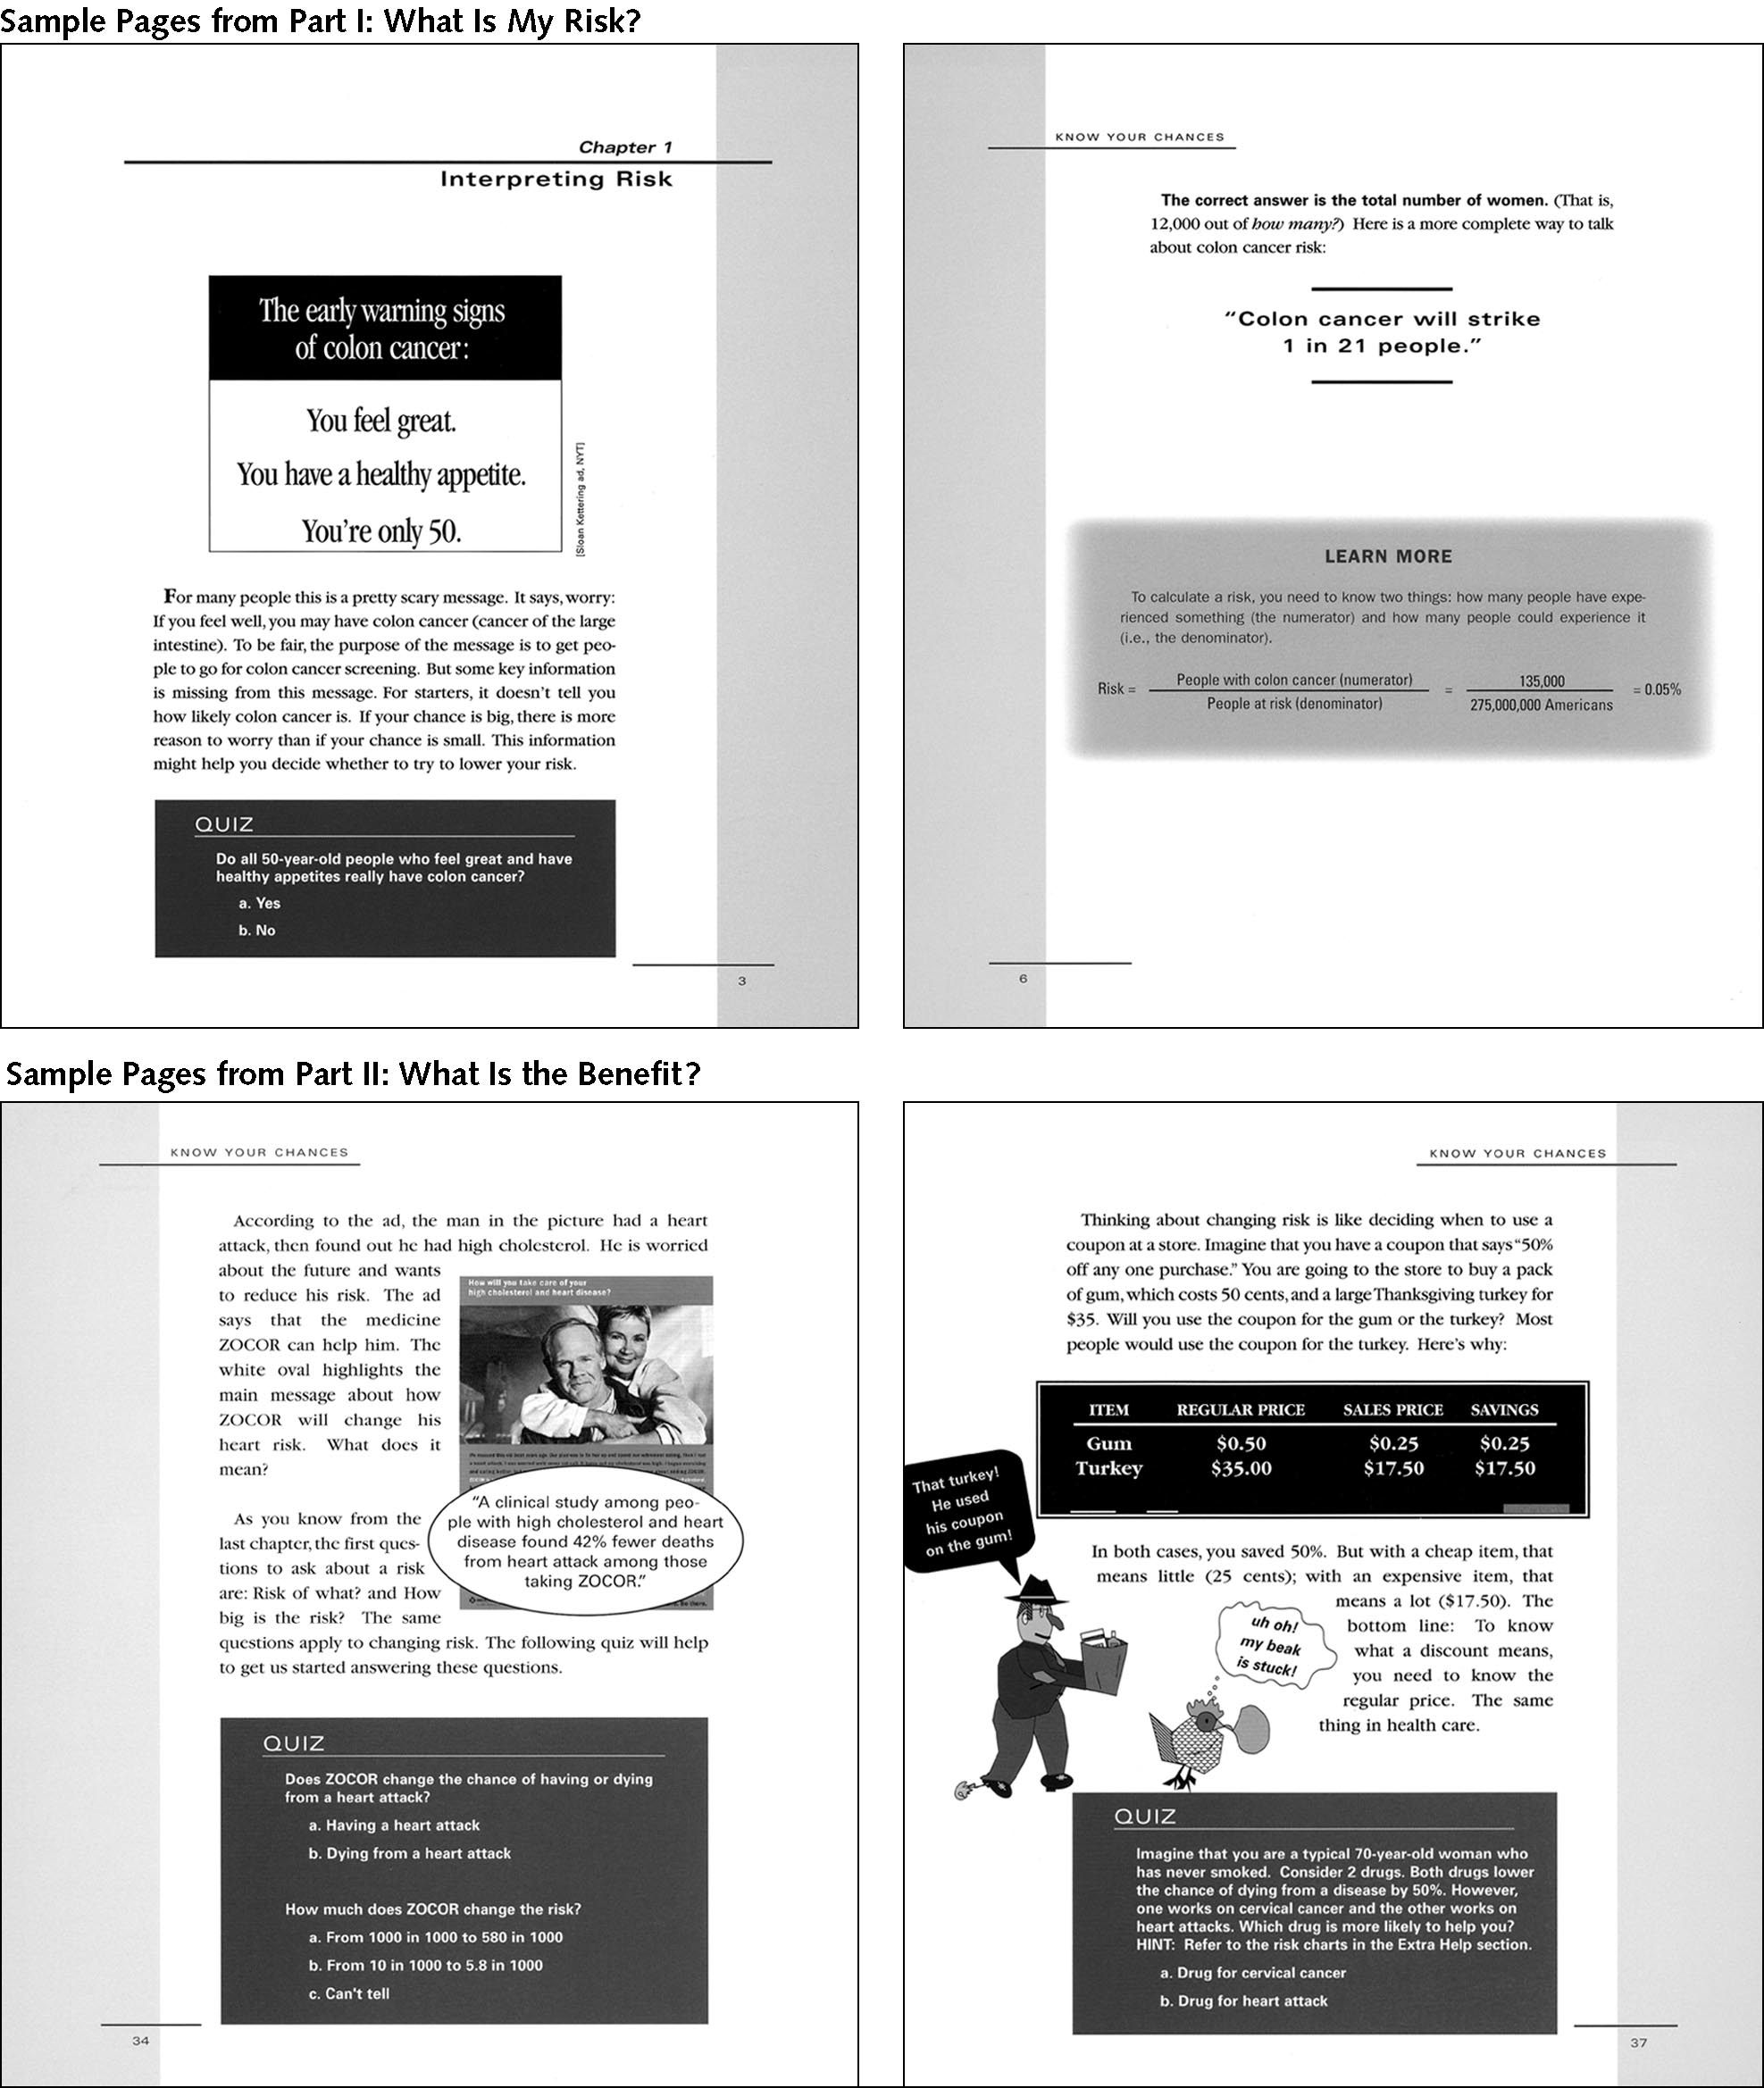
Figure 3 shows
first part of the primer teaches people how to understand
sample pages from the primer. Most of the primer is writ-
disease risk by using the example of colon cancer. The
ten at the eighth-grade or lower reading level (6) and is a
second part focuses on how to understand the benefits and
color document approximately 80 pages in length.
258 20 February 2007 Annals of Internal Medicine Volume 146 • Number 4
Testing a Primer on Risk Article
Table 1. Baseline Characteristics of Participants in the High Socioeconomic Status and Low Socioeconomic Status Trials*
High SES Trial (n ⴝ
322)
Low SES Trial (n ⴝ
200)
Primer Group
Primer Group
(n ⴝ
169)
(n ⴝ
153)
(n ⴝ
102)
(n ⴝ
98)
Mean age, y (range)
Household income, %
$10 000–$24 999
$25 000–$49 999
$50 000–$99 999
Highest level of education, %
⬍High school graduate
High school graduate
Postgraduate degree
Health status, %
Medical conditions, %
Heart or vascular disease
History of any type of cancer
Current smoker, %
Mean score on attitudes
Confidence interpreting
* The results are for completers only. Percentages may not add to 100% because of rounding. Item nonresponse for high and low SES trials, respectively, were age, 1% and1%; sex, 0% and 0%; income, 6% and 4%; education, 0.4% and 0.5%; race, 0.4% and 0.5%; health status, 1% and 1%; medical conditions, 0% and 0%; smoking, 0%and 0.5%; interest in statistics, 2% and 3%; and confidence, 0.7% and 0.5%. COPD ⫽ chronic obstructive pulmonary disease; SES ⫽ socioeconomic status.
† Scored on scales of 0 to 100 where higher scores represent higher interest or confidence.
Measurement and Outcomes
The control group received a 70-page booklet entitled
All outcome measures were assessed in the survey.
"The Pocket Guide for Good Health for Adults," which is
published by the U.S. Department of Health and Human
The primary outcome was a measure of participants'
Services Agency for Health Care Research and Quality (7).
abilities to interpret medical statistics. To measure this out-
We chose this booklet because the length is similar to that
come, we developed the 18-item data interpretation test
of the primer, it is written at a similar reading level (eighth
during the same time as the primer and validated it in a
grade or lower) (6), and it contains general information
separate study (8). The test is available at www.vaoutcomes
about risk and reducing risk by following recommended
.org/research_tools.php. It extends our original 3-item nu-
prevention or screening activities. However, it does not
merical measure (4) to include a much broader set of skills
include training on how to interpret quantitative informa-
beyond simple mathematical manipulation: such skills are
the ability to compare risks, to put risk estimates into con-
20 February 2007 Annals of Internal Medicine Volume 146 • Number 4
259
Article Testing a Primer on Risk
Figure 2. Key concepts taught in the primer, excerpted from the final pages.
text, and to know what additional information is necessary
eligibility interview) and again as part of the survey. These
to give meaning to a medical statistic. The data interpreta-
previously validated measures (STAT-interest and STAT-
tion test does not test recall of facts; instead, it asks people
confidence scales) are also scored on 0 to 100 scales in
to interpret real-world information (for example, drug ad-
which higher scores represent higher interest or confidence
vertisements and news stories). The skills being tested are
(9). In addition, we asked participants to rate each booklet
the same as those in the primer because we feel that they
on various dimensions (for example, Did you find it help-
are key skills for people to understand. However, the med-
ful? Did you learn something new?, and Would you rec-
ical data interpretation test requires that the respondent
ommend it to others?).
apply these skills to data (within various messages) that donot appear in the primer.
Scores from this test range from 0 to 100 — higher
The main results were based on complete case analysis
scores represent higher abilities. We consider a score of 75
with additional sensitivity analyses to address the impact of
or higher as "passing" and a score of 90 or higher as "out-
missing data. We used the chi-square test to compare dif-
standing" (the latter threshold corresponds to the mean
ferences in proportions and
t-tests to compare means. All
score of physician experts who teach "evidence-based"
comparisons were 2-sided and were considered statistically sig-
medicine in our validation study [8]).
nificant at
P values less than 0.05. We used Stata, version 9.1(Stata Corp., College Station, Texas) for all analyses.
Role of the Funding Sources
Secondary outcomes included measures of interest and
Drs. Woloshin and Schwartz are supported by Robert
confidence in interpreting medical statistics. These out-
Wood Johnson Generalist Faculty Scholars Awards and
comes were assessed twice: before randomization (at the
receive infrastructure support from a Research Enhance-
260 20 February 2007 Annals of Internal Medicine Volume 146 • Number 4
Testing a Primer on Risk Article
ment Award from the Department of Veterans Affairs. The
a household income of $50 000 or greater and 80% had a
study was supported by a grant from the National Cancer
college or postgraduate degree. In the low SES trial, approxi-
Institute (R01CA104721). The funding sources did not
mately 70% had a household income less than $50 000 and
play a role in the design, data collection, analysis, or inter-
approximately 50% had a high school degree or less formal
pretation of the study. The authors had full access to the
education. As expected, participants in the low SES trial were
data files for this study.
mostly men (recruitment was done at a VA hospital) and theparticipants in the high SES trial were mostly women (as has
typically been the case at the Dartmouth Community Medi-
cal School). The participants in the low SES trial had lower
Table 1 summarizes the characteristics of the partici-
self-reported health status, were more likely to smoke, and had
pants who completed the survey. As designed, the 2 trials
more medical conditions than those in the high SES trial.
had different participants. In the high SES trial, 70% had
Within each trial, however, there were no statistically signifi-
Table 2. Participants' Ratings of the Primer and Control Booklets*
Booklet Use
High SES Trial
Low SES Trial
Primer Group
Primer Group
(n ⴝ
169), %
(n ⴝ
153), %
(n ⴝ
102), %
(n ⴝ
98), %
About how much time did you
spend reading the booklet?
Was the booklet easy or hard to
Value of booklet
How helpful was the booklet?
I plan to refer to the booklet
when I make medicaldecisions in the future
I will recommend the booklet to
I wish I had read the booklet
I learned something new
* The results are for completers only. Completion rates for the control and primer groups were as follows: 98% vs. 95% (high SES trial) and 96% vs. 85% (low SES trial).
Percentages may not add to 100% because of rounding. Item nonresponse for the high and low SES trials, respectively, were time, 2.3% and 2.5%; difficulty, 0.4% and 3%;helpfulness, 1% and 2.5%; refer to later, 1.9% and 1.5%; recommend to others, 1.6% and 2%; read before, 1.9% and 1.5%; and learned, 1% and 1.5%. SES ⫽
20 February 2007 Annals of Internal Medicine Volume 146 • Number 4
261
Article Testing a Primer on Risk
Figure 3. Excerpts of primer.
262 20 February 2007 Annals of Internal Medicine Volume 146 • Number 4
Testing a Primer on Risk Article
Figure 4. Medical data interpretation scores (mean and proportion exceeding threshold) for the primer and control groups.
SES ⫽ socioeconomic status.
cant differences between the primer and control groups re-
To assess the effect of nonresponse on our findings, we
garding any characteristic assessed.
considered various possibilities of pass rates among the
Primary Outcome: Medical Data Interpretation Skills
nonresponders. Assuming that nonresponders have lowerdata interpretation skills, the most plausible "worst-case"
In both trials, the primer resulted in higher medical
scenario is that the nonresponders would have failed the
data interpretation scores than did the control booklet
test. In this case, the statistical significance of the low SES
(Figure 4). In the high SES trial, the mean score was 81 in
trial becomes borderline (37% vs. 25%; P ⫽ 0.057) but
the primer group versus 75 in the control group—a
remains significant in the high SES trial (70% vs. 54% ).
6-point difference (P ⫽ 0.0006). In terms of score thresh-
In the least plausible and most extreme "worst-case" sce-
olds, 74% of participants in the primer group received a
nario (assuming that all of the nonresponders in the primer
"passing grade" (score ⱖ75) versus 56% of participants in
group would have failed the test but that all nonresponders
the control group (P ⫽ 0.001). Twenty-six percent of par-
in the control group would have passed the test), the dif-
ticipants in the primer group received an "outstanding
ference in pass rates in the low SES trial becomes nonsig-
grade" (score of ⱖ90), which is the mean score of physi-
nificant (37% vs. 29%; P ⫽ 0.20), but remains significant
cian experts who teach evidence-based medicine in a vali-
in the high SES trial (70% vs. 57%).
dation study of this scale versus 7% of participants in thecontrol group (P ⬍ 0.001). In the low SES trial, the mean
scores were 69 in the primer group versus 62 in the control
Interest and Confidence
group—a 7-point difference (P ⫽ 0.008). Passing grades
Interest in medical statistics was significantly higher (6
were 44% versus 26% (P ⫽ 0.010) and outstanding grades
points) in the high SES trial (a 4-point increase vs. 2-point
were 10% versus 2% in the primer and controls groups,
decrease from baseline; P ⫽ 0.004) and by 8 points in the
respectively (P ⫽ 0.014). Finally, results were similar in
low SES trial (a 6-point increase vs. a 2-point decrease
additional analyses that adjusted for age, sex, level of edu-
from baseline; P ⫽ 0.004) after exposure to the primer
cation, and medical conditions: The difference in mean
compared with the control booklet. The primer, however,
interpretation scores was 7 points (P ⬍ 0.001) in the high
did not improve participants' confidence in interpreting
SES trial and 6 points (P ⫽ 0.019) in the low SES trial for
medical statistics beyond the control booklet; if anything,
the primer versus the control groups, respectively.
confidence improved more with the control booklet: by 2
The specific skills for which participants in the primer
points in the high SES trial (a 2-point increase vs. a 4-point
group most outperformed those in the control group were
increase; P ⫽ 0.36) and by 4 points in the low SES trial (a
as follows: recognizing that counts of events without de-
2-point increase vs. a 6-point increase; P ⫽ 0.166).
nominators do not convey risks (77% vs. 59% in the highSES trial and 54% vs. 41% in the low SES trial answered
Rating the Booklets
correctly) and knowing that a risk statement applies to you
Finally, participants spent substantial time reading the
requires knowing about the age and sex in the source data
primer and rated it highly (Table 2). In the high SES trial,
for the risk (81% vs. 55% in the high SES trial and 62%
72% of the primer group reported spending an hour or
vs. 37% in the low SES trial answered correctly).
more reading the primer, whereas only 28% of the control
20 February 2007 Annals of Internal Medicine Volume 146 • Number 4 263
Article Testing a Primer on Risk
group spent that much time reading their booklet (P ⬍
not hard to explain: The primer covered more challenging
0.001). Similarly, in the low SES trial, 74% of the primer
material (it required readers to do math) than did the con-
group spent an hour or more reading the primer, whereas
trol book. However, completion rates were high overall
47% of the control group spent this much time reading
(95% vs. 98% in the high SES trial and 85% vs. 97% in
their booklet (P ⫽ 0.001).
the low SES trial).
In the high SES trial, all ratings were significantly
Curiously, although the primer improved ability and
higher for the primer group than for the control group. For
stimulated general interest in medical statistics, it did not
example, 91% found the primer "helpful" or "very helpful"
increase participants' confidence in interpreting these sta-
versus 69% for the control booklet (P ⬍ 0.001). In the low
tistics any more than did the control booklet. This finding
SES trial, the primer ratings were high but were not statis-
probably reflects the educational impact of the primer. For
tically different from the ratings of the control booklet. For
some people (especially those with the least formal educa-
example, 94% and 90% of participants rated the primer
tion), acquisition of new data interpretation skills may
and control booklet "helpful" or "very helpful," respec-
highlight what they did not know before and may expose
tively (P ⫽ 0.26).
No analyses, including those for the secondary out-
How big was the change in data interpretation skills?
comes and booklet ratings, include participants who did
Because readers may be unfamiliar with our main outcome
not complete the survey. Because completion rates were
measure, they may have trouble gauging the clinical signif-
lower in the primer group versus the control group in the low
icance of our results. One way to put our findings into
SES trial (85% vs. 96%), the secondary outcomes and booklet
perspective is to consider the distribution of medical data
ratings may favor the primer group to the extent that nonre-
interpretation skills observed in our previous validation
sponders had a less favorable response to the primer.
study. In that study, the average difference in scores be-tween experts (medical school faculty who teach evidence-
based medicine) and other respondents with postgraduate
We developed and tested a general education primer
degrees (similar educational attainment but no relevant ex-
designed to teach people basic medical data interpretation
pertise) was 20 points (8). The 6- and 7-point differences
skills. The primer improved these skills in 2 distinct pop-
observed in the present study correspond to gaining ap-
ulations: participants with high SES and a demonstrated
proximately one third of the difference. Another way to
interest in health information (that is, they had attended a
put our findings into perspective is to consider the magni-
"community medical school" lecture series) and those with
tude of the primer's effect in relation to other educational
generally low formal education and limited quantitative
interventions. One way to make comparisons across inter-
skills. Participants liked the primer: A substantial majority
ventions is to translate our findings into generic "effect
of participants in both trials said they found it useful, it
size" units by using a metric called Cohen's d (primer mi-
taught them something new, and that they would recom-
nus control medical data interpretation scores divided by
mend it to others.
the pooled standard deviation of the scores) (10). Our re-
Our findings have several limitations. First is the ques-
sults correspond to Cohen's d effect sizes of 0.38 (high
tion of generalizability. Our study samples were chosen
SES) and 0.42 (low SES); by convention, these effect sizes
deliberately to ensure the participation of people across a
are considered to be between "small" and "medium," the
broad spectrum of age, income, and formal education. Be-
range covering many successful educational interventions
cause almost all participants were white and English speak-
(11). For context, on average, taking a practice examina-
ers, we cannot be certain how the primer would perform in
tion is associated with an approximate 0.30-effect size unit
a more ethnically diverse setting. Also, because all partici-
increase on standardized test scores (12).
pants were paid—those recruited from an actual health
Finally, it is important to acknowledge that although
care setting and those recruited from the community—we
we have demonstrated that exposure to the primer im-
cannot be certain how unpaid persons would respond to
proved medical data interpretation skills, we did not prove
the primer. Second, there may be concern regarding the
that the primer leads to better decision-making. Because
appropriateness of the control booklet. We chose an edu-
informed decision-making is not possible without under-
cational booklet (7) (published by the U.S. Department of
standing the relevant facts, we think improving data inter-
Health and Human Services Agency for Healthcare Re-
pretation skills is clearly a legitimate outcome in itself and
search and Quality) that was similar to the primer in length
a necessary prerequisite to making good decisions.
and tone. Because the control booklet did not teach readers
Implementing the primer, like decision aids, guide-
about interpreting risk, it worked as a "placebo" with re-
lines, or research innovations in general (13) may be chal-
spect to the main outcome measure (that is, the tests results
lenging. We believe there are several ways that the primer
on medical data interpretation in the control group should
could be used in clinical practice. It might be distributed
reflect existing abilities). Third, in both trials, completion
either before or after routine clinic visits when patients are
rates were lower in the primer group than in the control
making decisions regarding screening and prevention. It
group, particularly in the low SES trial. This observation is
might be even more important for patients facing such
264 20 February 2007 Annals of Internal Medicine Volume 146 • Number 4
Testing a Primer on Risk Article
high-stakes decisions as surgery or chemotherapy. It is pos-
Requests for Single Reprints: Lisa M. Schwartz, MD, MS, VA Out-
sible that patients facing a new and serious disease (for
comes Group (11B), Department of Veterans Affairs Medical Center,
example, a new diagnosis of cancer) may have greater mo-
White River Junction, VT 05009; e-mail, [email protected].
tivation to really understand the data regarding benefitsand harms of various interventions and would find the
Current author addresses and author contributions are available at www.annals.org.
primer very useful. Alternatively, they may feel too emo-tionally overwhelmed to use the primer. If this were thecase, the primer might be useful for families or friends who
are helping the patient with decision-making. Questions of
1. Edwards A, Elwyn G. Understanding risk and lessons for clinical risk com-
when and where the primer might be most effectively used
munication about treatment preferences. Qual Health Care. 2001;10 Suppl 1:i9-
and how the reader's emotional state, decision-making
13. [PMID: 11533431]
style, and preferences might influence its impact are clearly
2. Gazmararian JA, Baker DW, Williams MV, Parker RM, Scott TL, Green
a topic for further study.
DC, et al. Health literacy among Medicare enrollees in a managed care organi-
In conclusion, the primer "Know Your Chances: Un-
zation. JAMA. 1999;281:545-51. [PMID: 10022111]
3. Kirsch IS, Jungeblut A, Jenkins L, Kolstad A. Adult literacy in America: A
derstanding Health Statistics"—a simple, inexpensive, low-
First Look at Results of the National Adult Literacy Survey. Washington, DC:
tech intervention—improved medical data interpretation
U.S. Government Printing Office; 1993.
skills and was rated highly by well-educated participants as
4. Schwartz LM, Woloshin S, Black WC, Welch HG. The role of numeracy in
well as by those with less formal education.
understanding the benefit of screening mammography. Ann Intern Med. 1997;127:966-72. [PMID: 9412301]5. Dartmouth Community Medical School Home Page. Accessed at http://dms
From the Veterans Affairs Outcomes Group, White River Junction, Ver-
.dartmouth.edu/dcms on 14 December 2006.
mont, and the Center for the Evaluative Clinical Sciences, Dartmouth
6. Microsoft Corporation. Microsoft Word X. Flesch-Kincaid Readability Statis-
Medical School, Hanover, New Hampshire.
tics. Redmond, WA: Microsoft Corporation; 1983-2001.
7. Agency for Healthcare Research and Quality. The pocket guide for good
Disclaimer: The views expressed herein do not necessarily represent the
health for adults. Accessed at www.ahrq.gov/ppip/adguide/ on 14 September
views of the Department of Veterans Affairs or the U.S. government.
2006.
8. Schwartz LM, Woloshin S, Welch HG. Can patients interpret health infor-
Note: The first two authors contributed equally to the creation of this
mation? An assessment of the medical data interpretation test. Med Decis Mak-
manuscript. The order of authorship is arbitrary.
ing. 2005;25:290-300. [PMID: 15951456]
9. Woloshin S, Schwartz LM, Welch HG. Patients and medical statistics. Inter-
Acknowledgments: The authors thank Donald St. Germaine, MD, and
est, confidence, and ability. J Gen Intern Med. 2005;20:996-1000. [PMID:
Wendy Murphy for their assistance in recruiting Dartmouth Commu-
nity Medical School alumni; Jennifer A. Snide for technical assistance;
10. Thalheimer W, Cook S. How to calculate effect sizes from published research
and Baruch Fischhoff, PhD, and Wylie Burke, MD, PhD, for helpful
articles: a simplified methodology. Accessed at www.work-learning.com/effect_sizes.htm on 14 September 2006.
comments on earlier drafts of the primer.
11. Valentine J, Cooper H. Effect size substantive interpretation guidelines: Is-
sues in the interpretation of effect sizes. Washington, DC: What Works Clear-
Grant Support: Drs. Woloshin and Schwartz are supported by Robert
inghouse; 2003. Accessed at www.whatworks.ed.gov/reviewprocess/essig.pdf on
Wood Johnson Generalist Faculty Scholars Awards and receive infra-
15 September 2006.
structure support from a Research Enhancement Award from the De-
12. Kulik JA, Kulik CLC, Bangert RL. Effects of practice on aptitude and
partment of Veterans Affairs. The study was supported by a grant from
achievement test scores. Am Educ Res J. 1984;21:435-47. Accessed at www.jstor
the National Cancer Institute (R01CA104721).
.org/view/00028312/ap040083/04a00130/0 on 14 December 2006.
13. Haines A, Jones R. Implementing findings of research. BMJ. 1994;308:
Potential Financial Conflicts of Interest: None disclosed.
1488-92. [PMID: 8019284]
20 February 2007 Annals of Internal Medicine Volume 146 • Number 4 265
Annals of Internal Medicine
Current Author Addresses: Drs. Woloshin, Schwartz, and Welch: VA
Drafting of the article: S. Woloshin, L.M. Schwartz, H.G. Welch.
Outcomes Group (11B), Department of Veterans Affairs Medical Cen-
Critical revision of the article for important intellectual content: S.
ter, White River Junction, VT 05009.
Woloshin, L.M. Schwartz.
Final approval of the article: S. Woloshin, L.M. Schwartz, H.G. Welch.
Author Contributions: Conception and design: S. Woloshin, L.M.
Provision of study materials or patients: S. Woloshin, L.M. Schwartz.
Schwartz, H.G. Welch.
Statistical expertise: S. Woloshin, L.M. Schwartz.
Analysis and interpretation of the data: S. Woloshin, L.M. Schwartz,
Obtaining of funding: S. Woloshin, L.M. Schwartz.
20 February 2007 Annals of Internal Medicine Volume 146 • Number 4 W-69
Source: http://tdi.dartmouth.edu/images/documents/256.pdf
The Medical Letter On Drugs and Therapeutics Published by The Medical Letter, Inc. • 1000 Main Street, New Rochelle, N.Y. 10801 • A Nonprofit Publication DRUGS FOR PARASITIC INFECTIONS Parasitic infections are found throughout the world. With increasing travel, immigration, use of immunosuppressive drugs and the spread of AIDS, physicians anywhere may see in-
A FRD Market Entry Services Romania Report THE PHARMA AND FOOD SUPPLEMENTS MARKET IN ROMANIA DEMO REPORT by FRD CENTER MARKET ENTRY SERVICES ROMANIA The Pharma and Food Supplements Market in Romania – March 2010 A FRD Market Entry Services Romania Report 1. Pharma market in Romania. 3 1.1 Situation of the pharma market in Romania . 3 1.1. Non-prescription drugs. 4 1.2 Prescription drugs. 5