Allmanlab.caltech.edu
J Autism Dev Disord (2012) 42:2569–2584DOI 10.1007/s10803-012-1513-0
Microglia in the Cerebral Cortex in Autism
Nicole A. Tetreault • Atiya Y. Hakeem •Sue Jiang • Brian A. Williams • Elizabeth Allman •Barbara J. Wold • John M. Allman
Published online: 31 March 2012
! Springer Science+Business Media, LLC 2012
We immunocytochemically identified microg-
capillaries into brain tissue. The brain has its own immune
lia in fronto-insular (FI) and visual cortex (VC) in autopsy
system based on microglia, which are derived from the
brains of well-phenotyped subjects with autism and mat-
macrophage lineage and reside throughout the brain, where
ched controls, and stereologically quantified the microglial
they mount defenses against invading microorganisms and
densities. Densities were determined blind to phenotype
clear damaged tissue and metabolic waste (Graeber and
using an optical fractionator probe. In FI, individuals with
Streit ). This is achieved through phagocytosis,
autism had significantly more microglia compared to con-
in which the microglia ingest these substances.
trols (p = 0.02). One such subject had a microglial density
Nimmerjahn et al. (Davalos et al. ) and
in FI within the control range and was also an outlier
Wake et al. directly observed the activity of
behaviorally with respect to other subjects with autism. In
microglia in intact living mouse brains using two-photon
VC, microglial densities were also significantly greater in
microscopy in animals that express green fluorescent pro-
individuals with autism versus controls (p = 0.0002).
tein specifically in microglia. Their experiments showed
Since we observed increased densities of microglia in two
that microglial cell bodies are relatively stationary, but
functionally and anatomically disparate cortical areas, we
their fine processes are in constant motion on a minute-to-
suggest that these immune cells are probably denser
minute basis. They observed that the microglial processes
throughout cerebral cortex in brains of people with autism.
continually probe the immediate area, so that the popula-tion conducts a complete surveillance coverage of brain
Microglia ! Autism ! Fronto-insular cortex !
tissue every few hours. When the microglial processes
encounter damaged tissue, metabolic byproducts such asoxidized lipoproteins, or invading microorganisms, theyrespond by expanding and engulfing these substances and
transporting them back to the microglial cell body wherethey are stored for an indeterminate period of time. The
The brain is substantially isolated from the body's immune
microglia contact other types of glia and neurons as part of
system by the blood–brain barrier, which restricts the
their constant surveillance, but when they encounter other
passage of most immune cell types and proteins from
microglia there is mutual repulsion of their processes,which may account for their relatively uniform spacing.
There is also evidence that microglial processes can strip
N. A. Tetreault (&) ! A. Y. Hakeem ! S. Jiang !
synapses away from their dendrites, suggesting that
B. A. Williams ! B. J. Wold ! J. M. Allman
microglia may have another role in modifying neuronal
Division of Biology, California Institute of Technology, 1200East California Blvd., MC216-76, Pasadena, CA 91125, USA
connections in development and plasticity (Blinzinger and
Kreutzberg ; Graeber et al. ; Kreutzberg ;Paolicelli et al. Wake et al. ) reported through
in vivo imaging that microglia make transient direct con-
Comprehensive Autism Center, 2604 B El Camino Real #214,Carlsbad, CA 92009, USA
tact with synapses, and that the frequency of this contact is
J Autism Dev Disord (2012) 42:2569–2584
dependent on neural activity. In experiments in visual
Baltimore, as shown in Table FI was identified based on
cortex, microglia contact frequency was decreased by
criteria such as the presence of the Von Economo neurons
silencing the visual input by injecting tetrodotoxin into the
and sulcal location (Allman et al. and corresponds to
eyes (Wake et al. ). Inducing neural degeneration by
the posterior part of Brodmann's area 47. VC was identi-
transient ischemia increased the duration of microglial
fied by using the calcarine sulcus as a landmark; the
contact with synapses which was followed by synapse
dissections involved the sulcal lip corresponding to Brod-
elimination (Wake et al.
mann's areas 17 and 18. The NICHD Brain and Tissue
Microglia are closely related developmentally and
Bank for Developmental Disorders provided detailed
functionally to macrophages. Both originate from the
clinical records, with personal identification removed, for
monocyte lineage in the bone marrow. Microglia first
each individual with autism whose brain we studied, as
appear in small numbers in the brain during embryogene-
summarized in the phenotypic descriptions in Table To
sis, but they emerge prominently during the early postnatal
confirm the diagnosis of autism, the medical records of
period when they enter the brain from the bloodstream to
each person with autism were reviewed in depth by a
form what has been called the fountain of microglia, in
clinical psychologist (EA) who specializes in autism. In
which they migrate along the course of the fibers of the
each case we have at least one thorough clinical description
corpus callosum to all parts of the brain (Imamoto and
of the subject by either a psychologist or psychiatrist. Ten
Leblond The initial population of microglia can be
of our eleven subjects with autism had the autistic diag-
augmented by subsequent invasion into the brain of cir-
nostic interview-revised (ADI-R), which is the result of a
culating macrophages, which apparently assume the mi-
structured interview with a parent of the individual with
croglial phenotype after entering neural tissue (Schmid
autism. Three of the individuals with autism had ADIR
et al. ). In a preliminary study of gene expression, we
records, but the actual scores were not in the file. One
observed in some of our autistic cases increased expression
individual with autism had a childhood autism rating scale
of a network of genes centered on interleukin-6 (Tetreault
and met the criteria for an autism diagnosis. The records
et al. Interleukin-6, together with several other
additionally include measures of behavioral development
genes in the network, is characteristic of activated versus
such as the Bayley tests, as well as a history of medications
quiescent microglia (Thomas et al. ). People with
and other health issues reported by physicians and clinical
autism have significantly increased cytokines in frontal
psychologists, described in Table .
cortex and elevated levels of cytokines in the cerebro-spinal fluid compared to control subjects (Li et al. ;
Sectioning and Immunocytochemistry
Zimmerman et al. and there is evidence for immunesystem dysfunction in the development of autistic children
Samples were sectioned in the coronal plane at 50 lm on a
(Ashwood et al. ; Chez and Guido-Estrada
microtome with a vibrating blade (Microm HM 650 V) in
These observations motivated us to conduct a quantitative
0.1 M phosphate buffer solution (PBS) and stored in well
study of the density of microglia in brains of individuals
dishes with PBS and sodium azide. The microglia were
with autism compared to controls. Our goal in this work is
immunocytochemically stained with an antibody to IBA1
to quantify microglial differences between subjects with
(ionizing calcium adaptor molecule-1), the gene product of
autism and age-matched controls in two cortical areas,
the Aif1 gene (allograft inflammatory factor 1), raised
fronto-insular cortex (FI) and primary visual cortex (VC).
against the C-terminus of IBA1, which labels microglia and
Multiple lines of evidence have previously implicated FI in
monocytes. We used the IBA1 antibody because it yields
autism (Allman et al. Di Martino et al. ; Santos
excellent and selective staining of microglia in formalde-
et al. ); VC was selected because of its functional
hyde-fixed human archival brain tissue (Streit et al.
difference and anatomical distance from FI, in an effort to
The utility of IBA1 for the study of microglia has also been
span the diversity within neocortex.
shown through expression of the IBA1 gene coupled withenhanced
employing 2-photon microscopy to image the development
and motility of this class of cells in the brains of livingmice (Hirasawa et al. Wake et al. ). We used a
concentration of 1:1,000 of IBA1 antibody (Wako, CodeNo. 019-19741). Four batches of immunostaining were
Formaldehyde-fixed (8 % solution) human right FI and
performed including duplicate sections from both FI and
right VC tissue from subjects with autism and controls was
VC of each of the subjects, and each of the staining pro-
obtained from the NICHD Brain and Tissue Bank for
cedures showed consistent and robust immunostaining
Developmental Disorders at the University of Maryland-
across the sections. Free-floating sections were rinsed with
J Autism Dev Disord (2012) 42:2569–2584
Table 1 Autistic and neurotypical control subjects used for microglial density measurements
Fall from 9th story
Serotonin syndrome
Drowning with seizure
Cardiac arrhythmia
Subdural hemorrhage
Accident, multiple injuries
Multiple injuries
Multiple injuries
Multiple injuries
Multiple injuries
Head and neck injuries
The tissue source is NICHD Brain and Tissue Bank for Developmental Disorders at the University of Maryland, Baltimore, MD. The letters inthe age column are for the purpose of differentiating subjects of the same age in the graphs in Figs. and PMI post-mortem interval,X microglia density measurements were made for this structure
PBS and then incubated with 1 % citrate buffer (Chemicon,
without primary antibody and incubated with goat IgG at
cat # 21545) for 30 min at 37 "C for antigen retrieval.
the same concentration as the primary antibody. No
Sections were rinsed with PBS, treated to remove endog-
immunostaining was observed in these control sections.
enous peroxidase activity with 0.75 % hydrogen peroxideand methanol for 20 min, and then rinsed with PBS. The
Quantification of Microglial Densities
blocking step, to eliminate random antibody binding, used0.1 % Triton X-100, 4 % normal goat serum (NGS), 1 %
Microglial density in FI and VC was measured blind to
BSA, and 3 % dry milk in PBS for 3 h. Primary antibody
phenotype and quantified using the program Stereo Inves-
was incubated for 38 h at 4 "C in a PBS solution that
tigator (MBF Bioscience, Williston, VT) with a Reichert
included 0.1 % Triton X-100, 2 % NGS and 1:1000 anti-
Polyvar microscope equipped with a motorized stage and a
IBA1. Sections were then rinsed with PBS, incubated with
camera for visualization. All sections were quantified in at
biotinylated anti-rabbit (BA-1000,Vector Laboratories) at
least two separate replications with different regions of
1:200 for 2 h, and then rinsed again with PBS. A Vecta-
interest, and some sections were quantified up to four times
stain Elite ABC kit (pk-6100, Vector Laboratories) was
with both different and identical regions of interest. For all
used for the avidin–biotin-peroxidase method, then sec-
of the samples, duplicate sections of FI and VC were
tions were incubated for 30 min. After sections were once
classified and quantified for reproducibility. Independent
again rinsed with PBS, immunoreactivity was visualized by
raters quantified and classified blind random sections to
using a chromagen, 30-diaminobenzidine and nickel (SK-
replicate the method. The represented density measure is
4100, Vector Kit). Null control sections were incubated
an average of the blind replicated runs. Quantification was
J Autism Dev Disord (2012) 42:2569–2584
J Autism Dev Disord (2012) 42:2569–2584
J Autism Dev Disord (2012) 42:2569–2584
performed within a region of interest that spanned layerstwo to six; microglial distribution appeared relativelyhomogenous throughout the layers in our samples. Esti-mated cell counts were performed using the optical dis-sector probe at 409 magnification (oil immersionNA = 1.0) with a dissector height of 16 lm (flanked by2.0 lm guard zones), a counting frame of 260 lm 9160 lm and a grid size of 425 lm 9 425 lm. To avoidoversampling, we used the Gunderson counting rule suchthat cells intersecting only 3 of the 6 surfaces of the dis-sector cube were counted. Microglial density per mm3 wascalculated by dividing the optical fractionator estimate ofthe number of cells present in the full thickness of thesection within the region of interest by the area of the
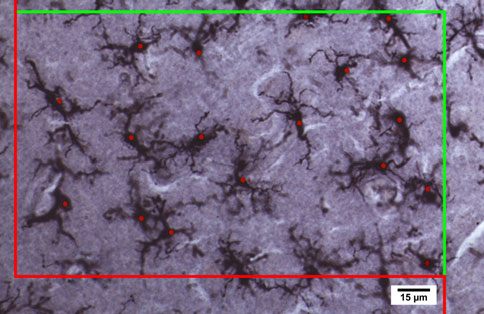
Fig. 1 Stereological procedure for quantifying and identifying
region of interest and the thickness at which the section
microglia in control and the brains of individuals with autism; thered and green frame defines the borders of the region of interest for
was cut to account for any tissue shrinkage.
counting microglial cells according to the Gundersen et al. ()procedure. A microglial cell was included if it was in the counting
Statistical Analysis
frame or if the soma crossed the green line and was excluded from thecounting when the cell soma crossed the red line to avoidoversampling. We used an optical dissector height 16 lm (flanked
Densities for the subjects with autism and control popula-
by 2.0 lm guard zones) and dissector probe at 409 magnification (oil
tions were compared using the Mann–Whitney test with
immersion NA = 1.0). Some of the cells are out of focus in the
two-tailed p value. Correlation levels between replications
photomicrograph, which is caused by the high numerical aperture of
were measured using Pearson's r-squared. Possible con-
the lens which creates many depth planes through the tissue which isnecessary for quantifying cells in three dimensions. Immunocyto-
founds in the subjects with autism that could alter mi-
chemical labeling with Iba1 (1:1000, Wako), a specific marker for
croglial densities were examined. Binary confounds,
microglia and macrophages (Sasaki et al. in FI of the 14 year
including whether death was by drowning and whether
old male with autism (UMB4315) (Color figure online)
seizures were present, were tested using the Mann–Whitney test; a possible confounding correlation with post-
with autism (n = 10) had significantly higher microglial
mortem interval was tested using Pearson's r-squared.
density (p = 0.02060) than control subjects (n = 12)(Mann–Whitney test with two-tailed p value).
The 12-year-old male UMB4305 was a unique case in
this group of people with autism because there was noincrease in microglial density compared with controls.
Figure depicts the stereological method and photomi-
Although the ADI-R scores for this case are in the autistic
crograph of the microglial quantification method in a brain
range, he was diagnosed as having pervasive develop-
of an individual with autism. We found significantly higher
mental disorder not otherwise specified (PDD-NOS), and,
density in the individuals with autism than in the controls
in addition, with psychosis NOS, and ADHD. UMB4305
in both FI (p = 0.0206, see Fig. ) and VC (p = 0.0002,
was the only one among all subjects tested who was treated
see Fig. ). The numbers are represented as the average of
for psychosis, including administration of the drugs que-
the microglial densities for the multiple replications per-
tiapine, olzapine, and risperdal (Table ). For these rea-
formed in each individual. Comparisons were made using
sons, we think this individual may have suffered from a
Mann–Whitney tests with two-tailed p values. The repeated
condition distinct from the other individuals who had the
quantifications in the same structure are highly signifi-
autism diagnosis. According to the neuropathology report
cantly correlated: for FI, and VC, r2 = 0.6480, p 0.0001
for UMB4305, ‘‘there were three small foci of yellow
(Fig. when the blind replications are from the exact ROI
discoloration noted in the leptomeninges overlying the
the correlation is r2 = 0. 9780, p 0.0001 for the intra-
right antero-inferior frontal pole, right gyrus rectus and left
rater reliability. Notably, the individuals with autism
gyrus rectus which measured 0.2 9 0.2 9 0.2 cm. Well-
cluster together in FI and VC, except for a single outlier
circumscribed regions of shrinkage and slight yellow dis-
subject with autism, while the controls all cluster together
coloration were present in the cortical ribbon underlying
in both FI and VC.
the discolored leptomeninges. … There was necrosis
Figure shows the microglial cell densities in FI of
around the small area of the contusions that included the
autistic subjects and controls for the combined and aver-
entire cortical ribbon through layer one. The small frontal
aged data for both microglial quantifications. Individuals
lobe contusions had visible macrophages surrounded by
J Autism Dev Disord (2012) 42:2569–2584
FI Microglia / mm
CN_2_M_MB5282 CN_4_M_MB4670
Fig. 2 Microglial densities in FI in subjects with autism and
D: cause of death was drowning. BD: brain damage, brain contusion,
neurotypical brains are represented as the average for the replicated
hemorhage, or edema. TD: traumatic death (MVA, fall) with possible
runs. Individuals with autism (n = 10) have a significantly greater
head injury, not explicitly mentioned. OD: drug overdose (not
density of microglia, the key cellular participants in the inflammatory
necessarily cause of death). S: seizures (not necessarily cause of
response in the brain, compared to controls (n = 12) p = 0.0206
death). Numbers in black are post-mortem interval in hours
(Mann–Whitney). LS: known to have spent time on life support.
reactive astrocytes observable with a hematoylin-eosin
Using the estimated value for human neocortical grey
stained sections.'' The report noted that beyond these local
volume from Frahm et al. ), which is 584,706 mm3,
contusions, the cortical layers were normal and the neurons
one can then estimate the density of microglia in the
in the cerebral cortex of the fronto-parietal lobe, hippo-
neurotypical human cortex by dividing by the total number
campus, basal ganglia, and cerebellum were unremarkable.
of microglia, which is approximately 5,951 (CD45 positive
Figure presents similar data for primary visual cortex
cells) per mm3 in the total human neocortex (Fig. b).
(VC). Total microglial densities were significantly greater
This is close to our estimated microglial densities for
in VC for the individuals with autism (n = 9) versus the
control (n = 11) subjects (p = 0.0002 Mann–Whitney test
In Table 5 of Lyck et al. (the column headed ‘‘total
with two-tailed p value). The increase in microglial density
neocortex'' refers to the neocortical gray matter only. In their methodsSection 2.2.7, ‘‘Estimation of Cell Numbers,'' they describe their
is present throughout almost our entire sample of subjects
selection of the region of interest, saying, ‘‘… followed by delineation
with autism, with ages ranging from 3 years of age to 22.
the border between white matter and neocortex at 2109 magnification
We address the two exceptions to this broad finding, UMB
(10 9 lens) marking the white matter as ‘exclusive region',''
1185 and UMB 1713, below.
indicating that their cell number estimates were made from a regionthat excluded white matter. Further, Fig. 2b from this paper indicates
After measuring microglial densities, we consulted Lyck
that the brain slices were segmented into ‘‘frontal neocortex,''
et al. (in which the number of microglia in the cortex
‘‘temporal neocortex,'' ‘‘parietal neocortex,'' ‘‘occipital neocortex,''
of three well-documented neurotypical brains was carefully
and ‘‘white matter,'' implying that the various neocortex segments do
and comprehensively quantified using a CD45 antibody
not include white matter. Thus, in Table 5 the column heads ‘‘frontalcortex,'' ‘‘temporal cortex,'' etc. presumably refer specifically to the
with unbiased stereology. They reported an average of 3.48
gray matter portions of those regions, and ‘‘total neocortex'' (which is
billion CD45 positive cells in the entire human neocortex.
a sum of the other four columns) also includes only gray matter.
J Autism Dev Disord (2012) 42:2569–2584
oglia / mm
CN_2_M_MB5282 CN_4_M_MB4670
Fig. 3 Microglial densities in visual cortex in autistic and neurotyp-
total microglia, the key cellular participants in the inflammatory
ical brains are represented for the average of the replicated runs.
response in the brain, compared to controls (n = 11) p = 0.0002
Individuals with autism (n = 9) have a significantly greater density of
control FI (6,479 microglia per mm3) and control VC
autism and found no statistically significant relationship
(6,048 microglial cells per mm3). In FI, individuals with
between microglial density and drowning versus other
autism had an 18 % higher microglial density compared to
causes of death; traumatic versus other causes of death;
our neurotypical cases, and in VC 21 % higher microglial
having been on life support or not; having a recorded drug
density compared to our neurotypical cases.
overdose or not; or having had seizures or not (Table
These findings demonstrate that, at the time of death,
There was no significant difference between the subjects
there were significantly higher microglial densities in the
with autism and controls with respect to age of the subjects
subjects with autism compared to the control subjects, and
or post-mortem interval (PMI). However, the controls had
that this change in microglial density is widespread
significantly greater (p = 0.0328) brain weight (1,501 g)
throughout the cerebral cortex in autism. The microglial
versus the subjects with autism (1,374 g) (Mann–Whitney
densities in FI and VC in the same subject were signifi-
test). This difference was driven mainly by one control
cantly correlated (both measures were available in 10
subject (M5387) with very high brain weight (1,750 g).
controls and 8 autistic subjects for a total of 18 subjects)
This is 310 g greater than the average brain weight
with Pearson's r2 = 0.4285, p = 0.0024 (Fig. This
(1,440 g) for a 12 year old male (Dekaban and when
indicates that the elevation in density is consistent between
the outlier is removed there is no significant difference in
these areas, and probably throughout the cortex, in both
brain weight between the subjects with autism and the
subjects with autism and controls.
control subjects. The differences in microglial density
We tested several confounding variables that could alter
between individuals with autism and controls remain sig-
microglial densities in FI and VC of the subjects with
nificant when the one outlier was removed for density
J Autism Dev Disord (2012) 42:2569–2584
oglia / mm
oglia / mm
Control FI count 1 vs. count 2
Averaged Counts (micr
Autistic FI count 1 vs. count 2
Control VC count 1 vs. count 2
Autistic VC count 1 vs. count 2
Microglia / mm3
FI Averaged Counts (microglia / mm3)
Fig. 4 The repeated blind density measurements are strongly corre-
Fig. 6 Microglial densities in FI and VC are significantly correlated.
lated. Density measurement count one in FI versus density measure-
Pearson's r2 = 0.4285, p = 0.0024, for the sample of 10 controls and
ment count two in FI and density measurement count one in VC
8 individuals with autism in which measurements were available for
versus density measurement count two in VC (Pearson's r2 = 0.6480,
both structures. Note that for both structures the individuals with
p 0.0001) for two different regions of interest (ROI). When the
autism (red) cluster, as do the controls (blue) (Color figure online)
blind replications are from the exact ROI the correlation is r2 = 0.
9780, p 0.0001. Notably, the subjects with autism (FI solid red
Microglial densities were negatively correlated with age
circles and VC outlined red circles) and controls (FI solid blue circles
in VC in our controls (Pearson's r2 = 0.6833, p = 0.0017)
and VC outlined blue circles) cluster in FI and VC, except for one
and barely missed statistical significance in FI (Table
autistic outlier in FI (Color figure online)
Microglial densities thus tend to decrease with age incontrols, while in people with autism the microglial den-
measurements (FI, p = 0.0257 and VC, p = 0.0001,
sities remain relatively high and constant with age in both
Mann–Whitney tests). In addition, brain weight and mi-
FI and in VC. Finally, microglial densities in VC in con-
croglial density were not significantly correlated in indi-
trols were negatively correlated with PMI (Pearson's
viduals with autism compared to control cases for FI and
r2 = 0.3952, p = 0.0383) but there was no significant
VC (Table Morgan et al. ) found brain weight was
correlation in VC for individuals with autism, or in FI for
negatively correlated with microglial density in the grey
either group (Table ). Morgan et al. (found that
matter, but that the microglial differences between subjects
microglial densities were negatively correlated with PMI
with autism and control subjects persisted when they sta-
across their subjects as a whole population but not for
tistically controlled for brain weight.
controls or people with autism as subgroups.
Fig. 5 a Average microglial
densities for subjects with
autism (red) and controlsubjects (blue) in FI incomparison to total microglial
density (black) estimated fromdata in Frahm et al. andLyck et al. b Average
microglial densities in VC.
oglia / mm
oglia / mm
Error bars represent the
standard deviation (Color figureonline)
J Autism Dev Disord (2012) 42:2569–2584
Table 3 Confound statistics for the autistic cases
FI autistics (6 drowning, 5 non-drowning): total density
VC autistics (5 drowning, 4 non-drowning): total density
drowning versus other COD, p = 0.7619 (ns)
drowning versus other COD, p = 0.2857 (ns)
FI autistics (4 seizures, 6 no seizures): total density seizures
VC autistics (3 seizures, 6 no seizures): total density seizures
versus no seizures, p = 0.2571 (ns)
versus no seizures, p = 0.7143 (ns)
FI autistics, total density versus PMI, N = 10, Pearson's
VC autistics, total density versus PMI, N = 9, Pearson's
r2 = 0.0658, p = 0.4743 (ns)
r2 = 0.00159, p = 0.9189 (ns)
FI controls, total density versus PMI, N = 12, Pearson's
VC controls, total density versus PMI, N = 11, Pearson's
r2 = 0.2628, p = 0.0883 (ns)
r2 = 0.3952, p = 0.0383 (significant)
FI autistics, total density versus brain weight, N = 10, Pearson's
VC autistics, total density versus brain weight, N = 9, Pearson's
r2 = 0.0077, p = 0.8095 (ns)
r2 = 0.1311, p = 0.3384 (ns)
FI controls, total density versus brain weight, N = 11, Pearson's
VC controls, total density versus brain weight, N = 10,
r2 = 0.00296, p = 0.6126 (ns)
Pearson's r2 = 0.0295, p = 0.6348 (ns)
FI autistics, total density versus age, N = 10, Pearson's
VC autistics, total density versus age, N = 9, Pearson's
r2 = 0.0080, p = 0.8054 (ns)
r2 = 0.3477, p = 0.0947 (ns)
FI controls, total density versus age, N = 12, Pearson's
VC controls, total density versus age, N = 11, Pearson's
r2 = 0.3159, p = 0.0572 (ns)
r2 = 0.6833, p = 0.0017 (significant)
Drowning, seizures, PMI age and brain weight do not account for the increase in microglial density for autistics compared to the controls. Thecontrols had significantly greater (p = 0.0302) brain weight (1,501.4 g) verses the autistics (1,356.7 g). This difference was driven mainly byone control subject (M5387) with very high brain weight (1,750 g) which is 310 g greater than the average brain weight (1,440 g) for a 12 yearold male (Dekaban ) and when the outlier is removed there is no significant difference (ns) for brain weight comparing the autistic andcontrol cases. The controls have a significant correlation for microglial density with age in VC (r2 = 0.6833 and p = 0.0017), where over timethe microglia decrease with age and a similar trend occurs in FI but does not reach statistical significance
We found that FI of two control subjects had unusually
with autism in grey and white matter. Five of Morgan
high microglial densities compared to the other controls.
et al.'s cases with autism overlap with those used in our
They were UMB1185, the 4-year-old control case, and the
study (Table ). We found that the subjects with autism we
23-year-old control UMB1713, who had suffered from
had in common with Morgan et al. showed an increase in
head and neck injuries. The injuries sustained by
microglial density in both FI (five subjects in common) and
UMB1713 are such that could cause an increase in mi-
VC (four subjects in common), which is consistent with
croglial density if death was not immediate (Engel et al.
Morgan et al.'s findings in dlPFC. In addition, Morgan
, Loane and Byrnes Both of these individuals
found five of the thirteen individuals with autism had an
showed increases in microglial densities in FI, but not in
increase in microglial activation (Morgan et al.
VC. By contrast, our subjects with autism had global
Precedent for Morgan's and our microglial observations
increases in microglial densities, shown both in FI and in
comes from Vargas et al. (who found significantly
VC. This regional difference suggests the possibility of
more microglial activation in the cerebellum of autistic
injury-related pathology in these two controls.
brains versus controls and a trend toward more microglialactivation in the middle frontal and anterior cingulatecortices, although the cortical results were not statistically
significant. One of our individuals with autism was used inthe Vargas study (Table ) (Vargas et al.
We observed increased densities of microglia in two dis-
Our methodologies differed, however, in several
parate cortical areas. One possibility is that these increased
respects from those of Morgan et al. ). We quantified
densities reflect abnormalities specific to these particular
microglia in two cortical regions, FI and VC, consistently
cortical areas, since there is evidence that each is involved
in the right hemisphere, whereas Morgan quantified a sin-
in autism, or alternatively these results may reflect a
gle region, dlPFC, using either the right or left hemisphere.
widespread difference that occurs throughout the cortex or
The reports of increased microglial densities are consistent,
even much of the brain. Consistent with the possibility that
but there are differences in density measurements in
the effect is pan-cortical, Morgan et al. ) reported an
Morgan's and our studies. The differences in density
increase in microglia in subjects with autism in dorsal
measurements for the individuals with autism and controls
lateral prefrontal cortex (dlPFC) compared to controls, and
can be attributed to our differing calculations and consid-
found an increase in somal size in microglia in subjects
eration of the shrinkage factor within the tissue. To account
J Autism Dev Disord (2012) 42:2569–2584
Table 4 Autistic cases used in the Vargas, Morgan and our study for microglial densities
Tetreault et al. (this study)
For this study we quantified two regions in cortex, FI and VC which have not previously been quantified and showed that six additional autisticcases have increased microglial density measures. An X indicates that the subject was evaluated in the study
for shrinkage, we calculated the microglial density per
control FI and VC that are near the expected densities
mm3 by dividing the optical fractionator estimate of the
calculated from Lyck et al. ) and Frahm et al. (
number of cells present in the full thickness of the section
On average the individuals with autism had 18–21 %
within the region of interest by the area of the region of
higher microglial density in FI and VC compared to neu-
interest and the thickness at which the section was cut. Our
rotypical subjects. How and when does the increased
results for control samples are very close to values calcu-
density of autistic microglial arrays arise, and how is it
lated for microglia based on the total number of microglia
maintained? Of course we have no data prior to the time of
in the entire neurotypical cortex determined through ster-
death, but the consistency of results among 10 subjects
eology (Lyck et al. and cortical volumes (Frahm
with autism of differing ages argues that people with aut-
et al. ) (see Fig. a, b).
ism have developed a remarkably stable steady-state
The differences between our study and Vargas et al.
microglial density. Given the age range, this is probably
() are that they stained microglia with an antibody to
established before age three. It is not clear how long the
HLA-DR and used an area fraction quantification method
increase in microglia persisted in each of the subjects with
based on the Delesse sampling procedure (Gundersen et al.
autism, but our results show that control subjects have a
). That method gives an estimate of the fractional area
significant negative correlation between microglial density
of the region of interest covered by the cell type being
in VC and age, indicating that microglial densities nor-
measured. The Delesse method does not, however, produce
mally decrease throughout childhood and early adulthood
cell numbers or three-dimensional densities. By contrast,
in neurotypical subjects. However, in people with autism,
we stained with an antibody to IBA1 and measured
there is a relatively steady condition of increased microg-
microglial density in our tissue. Though the specifics of
lial density from childhood into adulthood. It seems pos-
antibody and methods differed, our data taken together
sible that some persistent stimulus is the cause of this
with Vargas et al. (and Morgan et al. (point to
sustained higher level of microglial density in the subjects
elevated microglial density in autism, possibly involving
with autism. Imaging experiments of quiescent microglia in
the entire cerebral and cerebellar cortices. This argues that
intact living cortex suggest that they conduct a complete
further investigation of microglial abnormalities and the
surveillance of the cortex every few hours (Davalos et al.
microglial pathways in people with autism may be
; Nimmerjahn et al. ). The greater density, and
important for understanding the cellular basis of the autism
thus closer spacing of the microglia, in brains of individ-
uals with autism compared with control brains, suggests
There are also some caveats. We cannot be sure that
that this surveillance is more intense in autism.
IBA1 stains all microglia, and there is evidence for
Sickness behavior results from systemic infection and/or
microglial heterogeneity (Carson et al. Mittelbronn
inflammation, driving an increase in signals to the brain
et al. ; Schmid et al. However, the spacing of
that cause changes in metabolism, social withdrawal,
the stained microglia we have observed is consistent with
appetite suppression and a general ill feeling (Exton ;
complete coverage of a relatively regular array of microglia
Hart ; Perry ). Sickness behavior is another
in the cortex. In addition, we found microglial densities in
example of how a systemic infection or its related
J Autism Dev Disord (2012) 42:2569–2584
inflammation can alter both behavior and the inflammatory
among the originators of the pathologic processes in aut-
response in the brain. There is evidence that maternal viral
ism, or are they a response (perhaps even a protective one)
infection in the first trimester and bacterial infection in the
to some other aspects of this condition? Microglia have
second trimester are correlated with an increase in off-
neuroprotective functions including the phagocytosis of
spring reported to have autism (Atlado´ttir et al. ). In a
invading microorganisms and metabolic waste. The
recent microarray analysis of gene expression in brains of
increase of microglial densities in individuals with autism
individuals with autism compared to controls, Voineagu
could be a function of neuroprotection in response to
et al. (found a module of enriched immune and
microglial genes, although these genes have not been found
In contrast, microglia can also phagocytize synapses and
in genome wide association studies that have sought to
whole neurons, thus disrupting neural circuits. For exam-
identify genes that predispose to autism. Voineagu et al.
ple, when the axons of motor neurons are cut, the microglia
() conclude that the enriched gene expression of
strip them of their synapses (Blinzinger and Kreutzberg
immune and microglial genes observed in their study has a
; Cullheim and Thams Graeber et al.
non-genetic etiology and may reflect internal or external
Another example of the disruption of circuitry arises from
environmental influences, which suggests the possibility
the direct phagocytosis of neurons. Neurons communicate
that the sustained higher levels of microglia density in
with microglia by emitting fractalkine, which appears to
people with autism may also be environmentally mediated.
inhibit their phagocytosis by microglia. Deleting the gene
Chez and Guido-Estrada ) report that a subset of
for the microglial fractalkine receptor (Cx3cr1) in a mouse
people with autism have a consistent pro-inflammatory
model of Alzheimer's disease has the effect of preventing
condition of the brain and cerebral spinal fluid and pro-
the microglial destruction and phagocytosis of layer 3
posed that a systemic infection of the mother may lead to
neurons that was observed in these mice in vivo with
inflammation in the brain and autism. A recent report from
2-photon microscopy (Furhmann et al. In particular,
Wei et al. ) found an increase of IL6 in cerebellar
Cx3cr1 knockout mice have greater numbers of dendritic
cortex in subjects with autism, which could alter cell
spines in CA1 neurons, have decreased frequency sEPSCs
migration and disrupt imperative circuits for normal
and had seizure patterns which indicate that deficient
development (Wei et al. In a mouse model of
fractalkine signaling reduces microglia-mediated synaptic
maternal infection for offspring brain development, it has
pruning, leading to abnormal brain development, immature
been reported that offspring from a mother having a single
connectivity, and a delay in brain circuitry in the hippo-
injection of IL6 during pregnancy alters fetal brain devel-
campus (Paolicelli et al. ). In summary, the increased
opment (Smith et al. ) which indicates that a maternal
density of microglia in people with autism could be pro-
infection can impact brain development and may play a
tective against other aspects of this condition, and that a
critical role in autism. Girard et al. ), using a lipo-
possible side-effect of this protective response might
polysaccharide (LPS) mouse model of maternal inflam-
involve alterations in neuronal circuitry.
mation, found that a single treatment of an IL-1 receptorantagonist, concurrent with the LPS injection, had the
Microglial Defects as Causes of Disease
result that the IL-1 receptor antagonist protected againstmaternal placental inflammation and the offspring had
By contrast, there are diseases that arise from intrinsic
normal brain development. Furthermore, it is well docu-
defects in the microglia themselves which can cause ster-
mented that peripheral infection can dysregulate inflam-
eotypic behavioral dysfunctions. A naturally occurring
mation in the brain and increase monocyte infiltration into
genetic defect in human microglia is the cause of a
the cerebral cortex (D'Mello et al. ); it is also reported
remarkable neuropsychiatric disease that was first observed
that people with autism have elevated levels of cytokines
in Japan and Finland, but has subsequently been found
(Chez and Guido-Estrada which may disrupt the
throughout the world. Nasu-Hakola disease is caused by a
homeostatic balance in the cortex resulting in a greater
defect in the gene TREM2 or DAP12 which together form
density of microglia.
a receptor complex which is strongly expressed inmicroglia but not in astroglia or oligodendroglia (Paloneva
Are Microglia Predators or Protectors?
et al. Sessa et al. ). In the Allen Brain Atlas,DAP12 is preferentially expressed in olfactory, anterior
The increased microglial densities we observed in the
cingulate, and insular cortices in the mouse
cortices of our subjects with autism appear to be a robust
discriminator between the brains of people with autism
in TREM2 or DAP12 impair the capacity of the microglia
versus neurotypical brains, and these findings raise a major
to phagocytose damaged tissue and increase the secretion
question. Are markedly increased numbers of microglia
of inflammatory cytokines in the olfactory, insular and
J Autism Dev Disord (2012) 42:2569–2584
cingulate cortices resulting in microglia-mediated dementia
these structures to microglial disruption. This vulnerability
specific to these structures (Bianchin et al. ; Neumann
might also be related to the preferential expression DAP12
and Takahashi ). Bianchin et al. report that at
in the anterior cingulate and insular cortices. Area FI
around age 35 in affected patients there are: ‘‘[i]ncipient
investigated in our study corresponds to the ventral part of
personality changes that can only be noticed by relatives
anterior insular cortex. Thus, while changes in microglial
and close friends. The behavioral alterations then become
density appear to be widespread in brains of autistic indi-
progressively more evident during the next months. The
viduals, some areas may be more vulnerable than others to
patients start to present silly and facetious behavior, lack of
its effects.
insight, social inhibition, and other unrestrained behavior.
Sometimes they seem to have a euphoric attitude and are
Visual Abnormalities in Autism
easily distractible, seemingly lacking adequate associatedemotional components. As the disease progresses, the
When we began this investigation we anticipated microglial
patients evolve to a state of profound dementia.'' The
abnormalities in the frontal cortices because many lines of
remarkable behavioral specificity of the microglial defect
evidence suggest that these structures are involved in autism
in Nasu-Hakola disease shows that the microglia can
(Allman et al. ; Courchesne and Pierce ; Di Mar-
influence social behavior in a highly specific manner.
tino et al. ). We included visual cortex based first on its
Another stereotypic behavioral defect arising from
lack of involvement in prominent social and homeostatic
abnormal microglia is obsessive grooming in mice with a
functions and its physical distance from FI. Yet, abnormal-
mutation of the gene Hoxb8 (Chen et al. Hoxb8 is
ities in visual behavior are among the first signs of autism in
expressed only in the microglia in the adult mouse brain,
infancy. Beginning at the end of the first year, the earliest
and these cells originate in spinal bone marrow (Chen et al.
signs of autism include atypical eye contact and visual
). When adult mice with the Hoxb8 mutation were
tracking, and prolonged fixation, a tendency to perseverate
irradiated so as to kill the bone marrow and then received
visual attention on an original stimulus when presented with
bone marrow transplants with the intact gene, the mice
a competing stimulus (Zwaigenbaum et al.
recovered from their excessive grooming pathology, their
The increased microglial densities in visual cortex may
skin lesions healed, and their fur grew back to normal.
be representative of a pan-cortical microglial phenotype
When normal mice were irradiated and received bone
related to the autistic phenotype associated with perceptual
marrow from donors with the mutated Hoxb8 gene, they
integration. In Kanner's original description of autism he
developed the excessive grooming pathology. With these
emphasized his patients' intense fixation on detail and
experiments and a variety of other elegantly executed
‘‘inability to experience wholes without full attention to the
controls, Chen et al. ) demonstrated that the Hoxb8
constituent parts'' as a characteristic feature of the disorder
mutation with expression restricted to the microglia caused
(Kanner ). Frith (drew attention to the tendency
for typically developing children and adults to process
resembles obsessive–compulsive disorder in humans,
information for meaning and gestalt (global) form, often at
which involves abnormalities in orbito-frontal and anterior
the expense of attention to or memory for details and
cingulate cortices (Graybiel and Rauch These
surface structure. Happe and Frith (proposed that
structures are also implicated in autism (Allman et al.
autistic subjects show ‘‘weak central coherence,'' a pro-
; Di Martino et al. Santos et al. Simms
cessing bias favoring local information, and a relative
et al. The excessive grooming in the Hoxb8 mice is
failure to extract the gist or ‘‘see the big picture'' in
also reminiscent of the stereotypical behaviors that are
everyday life. The tendency of individuals with autism to
commonly found in a subset of individuals diagnosed with
focus on detail at the expense of global perceptions has
autism (Goldman et al.
been experimentally verified in many studies and may
Together with the striking changes in social behavior
account in part for impairments in the recognition of faces
present in Nasu-Hakola disease, these data suggest that the
(Behrmann et al. ; Happe and Frith ).
circuitry of anterior cingulate and orbito-frontal cortices
This difficulty perceiving the gist or global features of a
may be particularly sensitive to the disruptive effects of
stimulus configuration by subjects with autism may be
abnormal microglia. A strong association between reduced
analogous to the difficulties experienced by subjects with
activity in the anterior cingulate and anterior insular cor-
autism in making rapid intuitive decisions (Allman et al.
tices (adjacent to orbito-frontal cortex) in social tasks in
A variant of the ‘‘weak coherence'' theory applied to
subjects with autism versus controls was revealed in a
frontal lobe function and specifically linked to activated
meta-analysis of 24 functional imaging studies (Di Martino
microglia and their possible role in altering the development
et al. and the reduced activity in these structures in
of this structure was proposed by Courchesne and Pierce
autism may also be related to the apparent vulnerability of
). Happe and Frith propose that ‘‘weak
J Autism Dev Disord (2012) 42:2569–2584
coherence'' in autism is due to reduced connectivity
leukoencephalopathy—PLOSL): A dementia associated with
throughout the brain due to lack of synchronization of neural
bone cystic lesions. From clinical to genetic and molecularaspects. Cellular and Molecular Neurobiology, 24, 1–24.
activity (Brock et al. ) or lack of connecting fibers (Just
Blinzinger, K., & Kreutzberg, G. (1968). Displacement of synaptic
et al. or lack of top-down connections (Frith ). A
terminals from regenerating motoneurons by Microglial cells.
similar disruption of global connectivity might disrupt the
Zeitschrift fu¨r Zellforschung und Mikroscopische Anatomie, 85,
integrative functions of FI in social behaviors as suggested
Brock, J., Brown, C. C., Boucher, J., & Rippon, G. (2002). The
by the reduced activity in this area in subjects with autism
temporal binding deficit hypothesis of autism. Development and
versus controls (Allman et al. Di Martino et al. ).
Psychopathology, 4, 209–224.
An increased density of microglia throughout the cortex in
Carson, M. J., Bilousova, T. V., Puntambekar, S. S., Melchior, B.,
people with autism might contribute to these phenomena
Doose, J. M., & Ethell, I. M. (2007). A rose by any other name?The potential consequences of microglial heterogeneity during
through alterations in the neuronal circuitry.
CNS health and disease. Neurotherapeutics, 4, 571–579.
Chen, S. K., Tvrdik, P., Peden, E., Cho, S., Wu, S., Spangrude, G.,
et al. (2010). Hematopoietic origin of pathological grooming inHoxb8 mice. Cell, 141, 775–785.
Chez, M. G., & Guido-Estrada, N. (2010). Immune therapy in autism:
We found significantly increased microglial densities in
historical experience and future directions with immunomodu-
individuals with autism in two widely separated and
latory therapy. Neurotherapeutics, 7, 293–301.
functionally different cortical areas, FI and VC. In light of
Courchesne, E., & Pierce, K. (2005). Why the frontal cortex in autism
our findings, as well as increased densities in the cerebel-
might be talking only to itself: local over-connectivity but long-distance disconnection. Current Opinion in Neurobiology, 15,
lum (Vargas et al., and dorsal lateral prefrontal
cortex (Morgan et al. we propose that microglial
Cullheim, S., & Thams, S. (2007). The microglial networks of the
densities are elevated throughout the cerebral and cere-
brain and their role in neuronal network plasticity after lesion.
bellar cortices in individuals with autism. Future studies are
Brain Research Reviews, 55, 89–96.
Davalos, D., Grutzendler, J., Yang, G., Kim, J. V., Zuo, Y., Jung, S.,
needed to explain the mechanisms responsible for the
et al. (2005). ATP mediates rapid microglial response to local
increased densities and the relationship between this phe-
brain injury in vivo. Nature Neuroscience, 8, 752–758.
nomenon and the behavioral manifestations of autism.
Dekaban, A. S. (1978). Changes in brain weights during the span of
human life: Relation of brain weights to body heights and body
This work was supported by grants from the
weights. Annals of Neurology, 4, 345–356.
Simons Foundation (SFARI #137661), the James S. McDonnell
Di Martino, A., Ross, K., Uddin, L., Sklar, A., Castellanos, F., &
Foundation, and by NIH grant MH089406. The brain tissue and related
Milham, M. (2009). Processes in autism spectrum disorders: An
anonymous phenotypic information was obtained from the NICHD
activation likelihood estimation meta-analysis. Biological Psy-
Brain and Tissue Bank for Developmental Disorders. We especially
chiatry, 65, 63–74.
thank Dr. Ronald Zielke, Robert Johnson and Melissa Davis for pro-
D'Mello, C., Le, T., & Swain, M. G. (2009). Cerebral microglia
viding the brain tissue and anonymous clinical records; our study
recruit monocytes into the brain in response to tumor necrosis
would not have been possible without their dedicated service. We thank
factor alpha signaling during peripheral organ inflammation.
the anonymous reviewers for their helpful comments and criticisms.
Journal of Neuroscience, 29, 2089–2102.
Engel, S., Schluesener, H., Mittelbronn, M., Seid, K., Adjodah, D.,
Wehner, H. D., et al. (2000). Dynamics of microglial activationafter human traumatic brain injury are revealed by delayed
expression of macrophage-related proteins MRP8 and MRP14.
Acta Neuropathologica, 100, 313–322.
Allman, J. M., Tetreault, N. A., Hakeem, A. Y., Manaye, K. F.,
Exton, M. S. (1997). Infection-induced anorexia: Active host defense
Semendeferi, K., Erwin, J. M., et al. (2010). The von Economo
strategy. Appetite, 29, 369–383.
neurons in frontoinsular and anterior cingulate cortex in great
Frahm, H. D., Stephan, H., & Stephan, M. (1982). Comparison of
apes and humans. Brain Structure and Function, 214, 495–517.
brain structure volumes in Insectivora and Primates: I, neocor-
Allman, J., Watson, K., Tetreault, N., & Hakeem, A. (2005). Intuition
tex. Journal fu¨r Hirnforschung, 23, 375–389.
and autism: A possible role for von Economo neurons. Trends in
Frith, U. (2004). Is autism a disconnection disorder? Lancet
Cognitive Science, 9, 367–373.
Neurology, 3, 577.
Ashwood, P., Wills, S., & Van der Water, J. (2006). The immune
Furhmann, M., Bittner, T., Jung, C., Burgold, S., Ochs, S. M.,
response in autism: A new frontier for autism research. Journal
Hoffman, N., et al. (2010). Microglial Cx3cr1 knockout prevents
of Leukocyte Biology, 80, 1–15.
neuron loss in a mouse model of Alzheimer's disease. Nature
Atlado´ttir, H. O., Thorsen, P., Østergaard, L., Schendel, D. E., Lemcke,
Neuroscience, 13, 411–413.
S., Abdallah, M., et al. (2010). Maternal infection requiring
Girard, S., Tremblay, L., Lepage, M., & Se´bire, G. (2010). IL-1
hospitalization during pregnancy and autism spectrum disorders.
receptor antagonist protects against placental and neurodevel-
Journal of Autism and Developmental Disorders, 40, 1423–1430.
opmental defects induced by maternal inflammation. Journal of
Behrmann, M., Thomas, C., & Humphreys, K. (2006). Seeing it
Immunology, 184, 3997–4005.
differently: Visual processing in autism. Trends in Cognitive
Goldberg, W. A., Osann, K., Filipek, P. A., et al. (2003). Language
Science, 10, 258–264.
and other regression: Assessment and timing. Journal of Autism
Bianchin, M. M., Capella, H. M., Chaves, D. L., Steindel, M., Grisard,
and Developmental Disorders, 33, 607–616.
E. C., Ganev, G. G., et al. (2004). Nasu-Hakola disease
Goldman, S., Wang, C., Salgado, M. W., Greene, P. E., Kim, M., &
(polycystic lipomembranous osteodysplasia with sclerosing
Rapin, I. (2009). Motor stereotypies in children with autism and
J Autism Dev Disord (2012) 42:2569–2584
other developmental disorders. Developmental Medicine and
(TREM2) for central nervous tissue immune homeostasis.
Child Neurology, 51, 30–38.
Journal of Neuroimmunology, 184, 92–99.
Graeber, M. B., Bise, K., & Mehraein, P. (1993). Synaptic stripping in
Nimmerjahn, A., Kirchhoff, F., & Helmchen, F. (2005). Resting
the human facial nucleus. Acta Neuropathologica, 86, 179–181.
microglial cells are highly dynamic surveillants of brain
Graeber, M. B., & Streit, W. J. (1990). Microglia: Immune network in
parenchyma in vivo. Science, 308, 1314–1318.
the CNS. Brain Pathology, 1, 2–5.
Paloneva, J., Manninen, T., Christman, G., Hovanes, K., Mandelin, J.,
Graeber, M. B., & Streit, W. J. (2010). Microglia: Biology and
Adolfsson, R., et al. (2002). Mutations in two genes encoding
neuropathology. Acta Neuropathologica, 119, 89–105.
different subunits of a receptor signaling complex result in an
Graybiel, A. M., & Rauch, S. L. (2000). Toward a neurobiology of
identical disease phenotype. American Journal of Human
obsessive-compulsive disorder. Neuron, 28, 343–347.
Genetics, 71, 656–662.
Gundersen, H. J., Bendtsen, T. F., Korbo, L., Marcussen, N., Møller,
Paolicelli R. C., Bolasco G., Pagani F., Maggi L., Scianni M.,
A., Nielsen, K., et al. (1988). Some new, simple and efficient
Panzanelli P., et al. (2011) Synaptic pruning by microglia is
stereological methods and their use in pathological research and
diagnosis. Acta Pathologica, Microbiologica, et Immunologica
1456–1458. Epub 2011 Jul 21.
Scandinavica, 96, 379–394.
Perry, V. H. (2010). Contribution of systemic inflammation to chronic
Happe, F., & Frith, U. (2006). The weak coherence account: detail-
neurodegeneration. Acta Neuropathologica, 120, 277–286.
focused cognitive style in autism spectrum disorders. Journal of
Santos, M., Uppal, N., Butti, C., Wicinski, B., Schmeidler, J.,
Autism and Developmental Disorders, 36, 5–25.
Giannakopolous, P., et al. (2011). Von Economo neurons in
Hart, B. L. (1998). Biological basis of the behavior of sick animals.
autism: a stereological study of frontoinsular cortex in children.
Neuroscience and Biobehavioral Reviews, 12, 123–137.
Brain Research, 1380, 206–217.
Hirasawa, T., Ohsawa, K., Imai, Y., Ondo, Y., Akazawa, C., Uchino,
Sasaki, Y., Ohsawa, K., Kanazawa, H., Kohsaka, S., & Imai, Y.
S., et al. (2005). Visualization of microglia in living tissues using
(2001). Iba1 is an actin-cross-linking protein in macrophages/
Iba1-EGFP transgenic mice. Journal of Neuroscience Research,
microglia. Biochemical and Biophysical Research Communica-
81, 357–362.
tions, 286, 292–297.
Imamoto, K., & Leblond, C. P. (1978). Radioautographic investiga-
Schmid, C. D., Melchior, B., Masek, K., Puntambekar, S. S., Danielson,
tion of gliogenesis in the corpus callosum of young rats. II.
P. E., Lo, D. D., et al. (2009). Differential gene expression LPS/
Origin of microglial cells. Journal of Comparative Neurology,
IFNc activated microglia and macrophages: In vitro versus in vivo.
180, 139–163.
Journal of Neurochemistry, 109, 117–125.
Just, M. A., Cherkassky, V. L., Keller, T. A., & Minshew, N. J.
Sessa, G., Podini, P., Mariani, M., Meroni, A., Spreafico, R.,
(2004). Cortical activation and synchronization during sentence
Sinigaglia, S., et al. (2004). Distribution and signaling of
comprehension in high-functioning autism: Evidence of under
TREM2/DAP12, the receptor system mutated in human poly-
connectivity. Brain, 127, 1811–1821.
cystic lipomembraneous osteodysplasia with sclerosing leukoen-
Kanner, L. (1968). Autistic disturbances of affective contact. Acta
cephalopathy dementia. The European Journal of Neuroscience,
Paedopsychiatrica, 35, 100–136.
20, 2617–2628.
Kreutzberg, G. W. (1996). Microglia: A sensor for pathological
Simms, M. L., Kemper, T. L., Timbie, C. M., Bauman, M. L., & Blatt,
events in the CNS. Trends in Neurosciences, 19, 312–318.
G. J. (2009). The anterior cingulate cortex in autism: Hetero-
Li, X., Chauhan, A., Sheikh, A. M., Patil, S., Chauhan, V., Li, X. M.,
geneity of qualitative and quantitative cytoarchitectonic features
et al. (2009). Elevated immune response in the brain of autistic
suggests possible subgroups. Acta Neuropathologica, 118,
patients. Journal of Neuroimmunology, 207, 111–116.
Loane, D. J., & Byrnes, K. R. (2010). Role of microglia in
Smith, S. E., Li, J., Garbett, K., Mirnics, K., & Patterson, P. H.
neurotrauma. Neurotherapeutics, 7, 366–377.
(2007). Maternal immune activation alters fetal brain develop-
Lyck, L., Santamaria, I. D., Pakkenberg, B., Chemnitz, J., Schrøder,
ment through interleukin-6. The Journal of Neuroscience, 27,
H. D., Finsen, B., et al. (2009). An empirical analysis of the
precision of estimating the numbers of neurons and glia in
Streit, W. J., Braak, H., Xue, Q.-S., & Bechmann, I. (2009).
human neocortex using a fractionator-design with sub-sampling.
Dystrophic (senescent) rather than activated microglial cells are
Journal of Neuroscience Methods, 182, 143–156.
associated with tau pathology and likely precede neurodegener-
MacDonald, R., Green, G., Mansfield, R., Geckeler, A., Gardenier,
ation in Alzheimer's disease. Acta Neuropathologica, 118,
N., Anderson, J., et al. (2007). Stereotypy in young children with
autism and typically developing children. Research in Develop-
Tetreault, N. A., Williams, B. A., Hasenstaub, A., Hakeem, A. Y.,
mental Disabilities, 28, 266–277.
Liu, M., Abelin, A. C. T., et al. (2009) RNA-Seq studies of gene
Matson, J. L., & Lovullo, S. V. (2008). A review of behavioral
expression in fronto-insular (FI) cortex in autistic and control
treatments for self-injurious behaviors of persons with autism
stuides reveal gene networks related to inflammation and
spectrum disorders. Behavior Modification, 32, 61–76.
synaptic function. Program No. 437.3. 2009 Neuroscience
Minio-Paluello, I., Baron-Cohen, S., Avenanti, A., Walsh, V., & Aglioti,
Meeting Planner. Chicago, IL: Society for Neuroscience, 2009.
S. M. (2009). Absence of embodied empathy during pain observa-
tion in Asperger syndrome. Biological Psychiatry, 65, 55–62.
Thomas, D. M., Francescutti-Verbeem, D. M., & Kuhn, D. M. (2006).
Mittelbronn, M., Dietz, K., Schluesener, H. J., & Meyeremann, R.
Gene expression profile of activated microglia under conditions
(2001). Local distribution of microglia in the normal adult
associated with dopamine neuronal damage. The FASEB Jour-
human central nervous system differs by up to one order of
nal, 20, 515–517.
magnitude. Acta Neuropathologica, 101, 249–255.
Vargas, D. L., Nascimbene, C., Krishnan, C., Zimmermann, A. W., &
Morgan, J. T., Chana, G., Pardo, C. A., Achim, C., Semendeferi, K.,
Pardo, C. A. (2005). Neuroglial activtion and neuroinflammation
Buckwalter, J., et al. (2010). Microglial activation and increased
in the brains of patients with autism. Annals of Neurology, 57,
microglial density observed in the dorsolateral prefrontal cortex
in autism. Biological Psychiatry, 68, 368–376.
Voineagu, I., Wang, X., Johnston, P., Lowe, J. K., Tian, Y., Horvath,
Neumann, H., & Takahashi, K. (2007). Essential role of the
S., et al. (2011). Transcriptomic analysis of autistic brain reveals
microglial triggering receptor expressed on myeloid cells-2
convergent molecular pathology. Nature, 474, 380–384.
J Autism Dev Disord (2012) 42:2569–2584
Wake, H., Moorhouse, A. J., Jinno, S., Kohsaka, S., & Nabekura, J.
brain and alters neural cell adhesion, migration and synaptic
(2009). Resting microglia directly monitor the functional state of
formation. Journal of Neuroinflammation, 19(8), 52.
synapses in vivo and determine the fate of ischemic terminals.
Zimmerman, A., Jyonouchi, H., Comi, A., Connors, S., Milstien, S.,
The Journal of Neuroscience, 29, 3974–3980.
Varsou, A., et al. (2005). Cerebrospinal fluid and serum markers
Walters, A. S., Barrett, R. P., Feinstein, C., Mercurio, A., & Hole, W. T.
of inflammation in autism. Pediatric Neurology, 35, 195–201.
(1990). A case report of naltrexone treatment of self-injury and
Zwaigenbaum, L., Bryson, S., Rogers, T., Roberts, W., Brian, J., &
social withdrawal in autism. Journal of Autism and Developmen-
Szatmari, P. (2005). Behavioral manifestations of autism in the
tal Disorders, 20, 169–176.
first year of life. International Journal of Developmental
Wei, H., Zou, H., Sheikh, A. M., Malik, M., Dobkin, C., Brown, W.
Neuroscience, 23, 143–152.
T., et al. (2011). IL-6 is increased in the cerebellum of autistic
Source: http://www.allmanlab.caltech.edu/pdfs/Tetreault2012.pdf
ADMINISTRATIVE POLICIES Effective Date: October 1, 2012 AND PROCEDURES State of Tennessee Department of Correction Supersedes: 501.01 (9/15/10) Approved by: Derrick D. Schofield Subject: INMATE GRIEVANCE PROCEDURES AUTHORITY: TCA 4-3-603, TCA 4-3-606, and TCA 41-24-110 and Title 28 CFR 115. PURPOSE: To establish a standard procedure for the expression and resolution of inmate complaints.
The AAPS Journal ( # 2012)DOI: 10.1208/s12248-012-9382-1 Theme: Facilitating Oral Product Development and Reducing Regulatory Burden through Novel Approaches to Assess Bioavailability/BioequivalenceGuest Editors: James Polli, Jack Cook, Barbara Davit, and Paul Dickinson Bioequivalence Requirements in the European Union: Critical Discussion Alfredo García-Arieta1,3 and John Gordon2