Jc001909 1.10
JOURNAL OF GEOPHYSICAL RESEARCH, VOL. 109, C09S14, doi:10.1029/2003JC001909, 2004
Dissolved and particulate organic carbon in the Sea of Okhotsk:
Transport from continental shelf to ocean interior
Takeshi NakatsukaInstitute of Low Temperature Science, Hokkaido University, Sapporo, Japan
Mari TodaGraduate School of Environmental Earth Science, Hokkaido University, Sapporo, Japan
Kimitaka Kawamura and Masaaki WakatsuchiInstitute of Low Temperature Science, Hokkaido University, Sapporo, Japan
Received 14 April 2003; revised 10 May 2004; accepted 8 June 2004; published 21 August 2004.
Dissolved and particulate organic carbon (DOC and POC) were measured in water
columns of the Sea of Okhotsk together with other hydrological and chemical properties,including phytoplankton pigments (Chl-a) and stable carbon isotopic ratios (d13C) ofPOC. Transects from shelf to slope off the northeast coast of Sakhalin showed theexistence of a cold-water mass in the intermediate layer on the slope area having a densityof 26.7 – 27.0 sq, which is equivalent to the cold and dense water on the shelf (dense shelfwater: DSW). The cold intermediate water mass was rich in DOC, POC, and Chl-a,and the d13C of POC was high, similar to that in DSW, indicating that the organic matter inthe cold intermediate water is exported from the highly productive shelf area by theoutflow of DSW. On the other hand, surface waters near the coast of northern Sakhalin hada very low salinity, which must be affected by the fresh water discharge from the AmurRiver. The low-salinity water contained a large amount of DOC that was more than3 times greater than the pelagic surface waters. The linear regression line between thesalinity and the DOC in the surface layer of the studied area indicates that the Amur Riverwater contains approximately 690 mM of DOC, and the input of DOC from the Amur tothe Sea of Okhotsk was estimated to be approximately 2.5 TgC/yr. The relationshipsbetween the temperature and the DOC and POC along a density surface from 26.7 to 27.0 sqsuggest that DOC and POC in the DSW are transported into the intermediate layer of thepelagic region without being removed at the shelf edge. Simple estimates for additions oforganic carbon into the intermediate layer of the area off the east coast of Sakhalin suggeststhat DSW outflow from the shelf brings into this layer approximately 13.6 and 0.9 TgC/yrof DOC and POC, respectively. These fluxes are much larger than the sinking POC fluxfrom the in situ surface water, and so are fundamental in characterizing thebiogeochemical cycles in the Sea of Okhotsk.
INDEX TERMS: 4806 Oceanography: Biological
and Chemical: Carbon cycling; 4805 Oceanography: Biological and Chemical: Biogeochemical cycles (1615);4219 Oceanography: General: Continental shelf processes; KEYWORDS: DOC, POC, Sea of Okhotsk
Nakatsuka, T., M. Toda, K. Kawamura, and M. Wakatsuchi (2004), Dissolved and particulate organic carbon in the Sea of
Okhotsk: Transport from continental shelf to ocean interior, J. Geophys. Res., 109, C09S14, doi:10.1029/2003JC001909.
nental shelf, the carbon cycle of the shelf has not yet beenclarified in detail because the water circulation systems in
[2] In the global carbon cycle, the continental shelf must
coastal areas are usually very complicated and the dissolved
play a special role because the shelf acts as an interface,
and particulate organic carbons (DOC and POC) are trans-
exchanging organic and inorganic carbon materials between
ported by various physical mechanisms between coastal and
land and ocean. Moreover, the continental shelf usually has
very high biological productivity reflecting macro- and
[3] Recently, Bauer and Druffel [1998] claimed that ocean
micro-nutrient inputs from river mouths, which results in
margins including the shelf and slope areas act as a signif-
the absorption of a large amount of carbon dioxide from the
icant source of organic matter for the deep open ocean, based
atmosphere. In spite of the great importance of the conti-
on the horizontal difference of profiles of 14C in DOC andPOC between the central and eastern North Pacific waters.
Hansell et al. [2002] suggested that the DOC in the North
Copyright 2004 by the American Geophysical Union.
0148-0227/04/2003JC001909$09.00
Pacific Intermediate Water (NPIW) is refreshed by the input
NAKATSUKA ET AL.: DOC AND POC IN THE SEA OF OKHOTSK
of young DOC (14C age) from the mixed water region offnorthern Japan. They also suggested that one source area forthe young DOC into the NPIW is the Sea of Okhotsk,according to the previous reports for the water ventilationprocess in this area [Yasuda et al., 1996; Talley, 1997].
[4] In relation to this background, we have reported
material transport from the continental shelf to thedeep sea in the Sea of Okhotsk using a turbidity profiler[Nakatsuka et al., 2002]. The Sea of Okhotsk is a marginalsea located on the northwestern rim of the Pacific Oceanand is known as a seasonal sea ice area [Alfultis and Martin,1987; Kimura and Wakatsuchi, 2000]. A large volume ofcold brine water is rejected and settles on the bottom of thenorthwestern continental shelf along the Siberian coastduring sea-ice formation in winter [Martin et al., 1998;Gladyshev et al., 2000]. Even after entraining the sea-icebrine, the density of the bottom water on the shelf (denseshelf water, DSW) generally does not exceed 27.0 sq,reflecting the inflow of Amur River water. Therefore, coldbrine water does not spread to the deep layer but ratherpenetrates to the intermediate depths (200 – 500 m) to mixwith the Okhotsk Sea Intermediate Water (OSIW) [Kitani,1973; Wong et al., 1998; Itoh et al., 2003], which finallyflows out of the Sea of Okhotsk to join the formation ofNPIW [Talley, 1991]. Because the DSW always containslarge amounts of resuspended sedimentary particles due to a
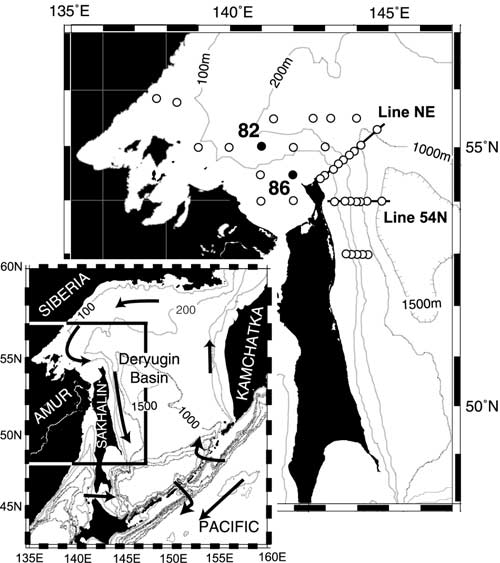
Map of the observed area in the Sea of Okhostk.
strong tidal mixing on the shelf [Kowalik and Polyakov,
Open and solid circles are the sites of measurements of
1998], the outflow of DSW results in a large flux of
dissolved and particulate organic carbon. Line-54N and
particulate materials from the shelf to the open ocean
Line NE correspond to the sections illustrated in Figures 2
[Nakatsuka et al., 2002]. In spite of the temporal sea-ice
and 3, respectively. Solid circles indicate the sites where
cover, the primary productivity of the Sea of Okhotsk is
profiles in the water column are shown in Figures 4 and 6.
very high, especially on the continental shelf [Sorokin and
Arrows in the smaller figure show the main direction of
Sorokin, 1999; Saitoh et al., 1996], due to the relatively
water current in the Sea of Okhotsk.
high insolation and the major nutrient and micronutrientinput from the Amur River. Therefore DSW flowing intoOSIW may export not only the resuspended sedimentaryparticles but also fresh organic matter produced on the shelf.
of Okhotsk (Figure 1). The stations for water sampling were
[5] In order to evaluate the role of dense water outflow in
located on the northwestern continental shelf, off the
transporting biologically produced materials from the shelf
northeastern coast of Sakhalin Island and the area near the
to the deep open ocean, in addition to particulate matter, it is
Amur River mouth. These stations were arranged so as to
necessary to measure the dissolved organic matter. The
clarify the effect of the Amur River discharge and DSW
spatial distributions of DOC and POC in the Sea of Okhotsk
outflow for the transport of organic matter through the
have been investigated [Agatova et al., 1996]. However, the
continental shelf areas to the OSIW in the Sea of Okhotsk,
mechanisms determining their distributions have not yet
which finally connects to the North Pacific Ocean.
been clarified. We present here the data sets of both POC
[7] Sampling was carried out throughout the water
and DOC in the Sea of Okhotsk, including the continental
column at every sampling station using a Seabird CTD-Water
shelf and slope areas as well as the area near the Amur River
sampling system equipped with 24 10-L Niskin bottles.
mouth. Using these data, we discuss the effects of dense
Approximately 30 mL of water was poured directly into a
water outflow and river water input for the transport of
40-mL precleaned (and precombusted) glass vial from the
organic matter through the continental shelf area in the Sea
valve of each Niskin bottle, and the glass vials with water
of Okhotsk, possibly to the North Pacific Ocean. The stable
samples were tightly capped with clean rubber-sealed screw
carbon isotope ratios (d13C) of particulate organic carbon
caps and immediately stored in a freezer ( 30�C) until total
(POC) and the chlorophyll concentrations (Chl-a) were
organic carbon analyses at a shore-based laboratory.
measured in order to assess the origin of POC.
[8] Another 1000 mL of water was collected in a plastic
bottle, and immediately filtered onto a 450�C precombustedWhatman GF/F filter of 25 mm diameter on board. The
Materials and Analytical Methods
filters with suspended particles were packed into aluminum
Water Sampling and Sample Preparations
foil and stored in a freezer ( 30�C) until particulate organic
[6] Water samples for organic carbon analyses were
carbon analyses in the laboratory. However, water samples
collected in June 2000 during a research cruise with R/V
could not be filtered at layers shallower than 100 m at the
Professor Khromov (Far Eastern Regional Hydrometeoro-
three sites in Line-54N (Figure 1) off the northeastern
logical Research Institute, Vladivostok, Russia) in the Sea
Sakhalin Island due to the limited time aboard ship.
NAKATSUKA ET AL.: DOC AND POC IN THE SEA OF OKHOTSK
[9] For the measurement of Chl-a, 200 mL of water was
analyzed the stable carbon isotopic ratio of POC, using a
collected in a dark plastic bottle at each layer shallower than
continuous flow system (ThermoQuest, Conflo-II), which
200 m at every sampling site. The water samples were
introduces the CO2 gases with He carrier discharged from
immediately filtered onto the 25-mm diameter Whatman
the elemental analyzer directly into the isotopic ratio
GF/F filters. The filters were inserted into plastic tubes
mass spectrometer (ThermoQuest, Delta-Plus). The stable
together with 6 mL of dimethyl formamide solution and
carbon isotopic ratio is represented as d13C, where d13C =
then stored, wrapped in aluminum foil, in a freezer ( 30�C)
1] � 1000 (%), and the
until the Chl-a analyses. Along an east-west transect on
standard deviation of the measurement is within 0.2%.
54�N off the northeastern Sakhalin Island, water samples forChl-a measurement were collected not only at 0- to 200-m
Chlorophyll a (Chl-a)
depths but also throughout the water column to its bottom in
[13] The amounts of the extracted chlorophyll a and phaeo-
order to detect the transport of fresh organic matter into the
pigment in dimethyl formamide solutions were measured
ocean interior by DSW outflows.
using a fluorescence spectrophotometer (Turner, 10-AU) inthe laboratory of Sei-ichi Saito, at the Graduate School of
Total Organic Carbon (TOC)
Fishery Science, Hokkaido University.
[10] Frozen water samples in 40-mL glass vials were
Turbidity Profiles in the Water Column
thawed in running water and homogenized for 10 min by
ultrasonic vibration. A volume of 100 mL of 6N HCl
During the CTD/water sampling, a laser forescattering
type of turbidity meter (ALEC Denshi, ATU6-8M) was
solution was added into the 10 mL of melted water, and
attached to the frame of the water sampler. This instrument
all carbonate materials were purged by bubbling with pure
directly presents turbidity data in parts per million, according
air for 10 min. The decarbonated waters were directly
to a conversion factor determined using kaolinite suspensions
analyzed for the TOC, including dissolved and suspended
in the factory [Nakatsuka et al., 2002].
organic carbon, using a TOC analyzer (Shimadzu, TOC-5000). The concentration of dissolved organic carbon(DOC) was determined by the subtraction of particulate
Results and Discussions
organic carbon (POC) content, which was measured as
[15] We illustrate two-dimensional sections of tempera-
described below, from TOC content.
ture, salinity, density, turbidity, DOC, POC, Chl-a, and d13C
[11] Each water sample was measured 3 times, with the
of POC along Line-54N and Line-NE (Figure 1) in Figures 2
mean peak area taken to determine concentrations. The
and 3, respectively, using Ocean Data View (R. Schlizer,
TOC content for each water sample was calculated using
a calibration line, which was created before the analyses of
2002), and explain the spatial distributions of those prop-
sample waters every day, by the combustion of waters
erties and discuss their causes in detail.
containing standard reagents (potassium hydrogen phtha-late). The ultra-pure water (Milli-Q water) used for dilution
of the reagent always contained approximately 7 mM of
[16] We can find two very cold water masses (< 1�C) in
organic carbon contamination, which must be attributed to
this section (Figure 2a). Both are located at between 50 and
either the ultra-pure water (water blank) or the TOC
100 m in depth; one is on the shelf and the other is above
analyzer itself (instrument blank). In the present study, we
the deep basin. Because the salinity is different between
assumed that the 7 mM of organic carbon originated from
those two cold regions (Figure 2b), the former has a
the ultra-pure water itself, and we then calculated the
potential density of 26.7 – 26.9 sq, which is equivalent to
contents of TOC in the water samples using the slope of
that of the intermediate water mass between 200 and 400 m
calibration lines. If the 7 mM of organic carbon contains
far below the latter mass (Figure 2c). The cold and dense
instrument blank as well, the results of TOC in the present
water mass on the shelf can be regarded as the DSW, which
study must be overestimated to a certain degree. However,
has been produced by the rejection of saline brine water
this does not affect our primary discussion, because the
from sea ice during the last winter [Martin et al., 1998;
amount of the blank carbon is very small and is almost
Gladyshev et al., 2000]. On the other hand, the offshore
constant (7.3 ± 0.3 mM) compared with the actual range of
cold subsurface water is called the ‘‘dichothermal layer,''
TOC concentration measured in the Sea of Okhotsk (60 –
which was formed by the cooling of the pelagic surface
450 mM). The standard deviation was usually within 1 –
water in winter and which can be found all over the open
2 mM (1s) for each sample measurement.
area in the Sea of Okhotsk. In relation to the higher densityof the DSW, it is important to note the existence of a low-
Particulate Organic Carbon (POC) and Stable
temperature intermediate water mass (<1�C) on the slope
Carbon Isotopic Ratio (D13C) of POC
(300 – 450 m), which is obviously colder than surrounding
[12] Frozen 25-mm GF/F filters, which contain POC, were
waters (Figure 2a). Because the density range of this water
thawed and first acidified by the addition of several drops of
mass, 26.8 – 26.9 sq, is almost identical to the DSW on the
20% HCl to remove all carbonate materials. After drying the
shelf, this intermediate cold water mass on the slope must
GF/F filters by leaving them in a clean glass desiccator for 1
be affected by the discharged DSW from the continental
to 2 days together with a dish of NaOH pellets and P2O5
shelf. Both the DSW and the cold slope water mass had a
powder, the filters were cut and wrapped with large tin
high turbidity (Figure 2d), suggesting the same origin of
capsules and then measured with respect to carbon content
these water masses [Nakatsuka et al., 2002].
using an elemental analyzer (Fisons, NA-1500). In order to
[17] The cold intermediate water mass on the slope is also
discuss the origin of POC in the Sea of Okhotsk, we also
rich in organic matter. Concentrations of both DOC and
NAKATSUKA ET AL.: DOC AND POC IN THE SEA OF OKHOTSK
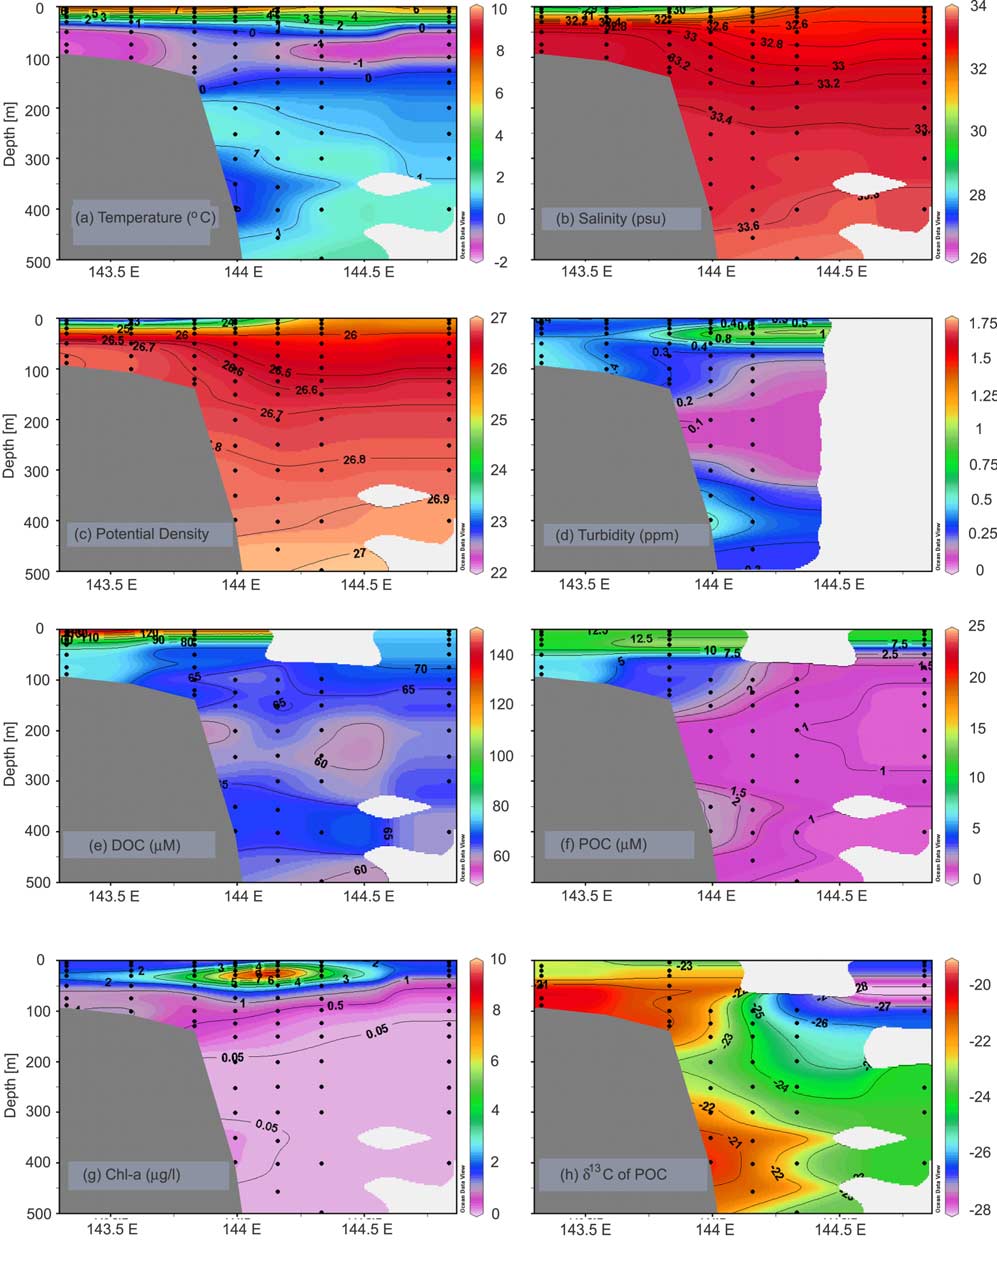
Vertical sections of (a) temperature, (b) salinity, (c) potential density, (d) turbidity,
(e) dissolved organic carbon (DOC), (f) particulate organic carbon (POC), (g) Chl-a, and (h) stable carbonisotopic ratio (d13C) of POC along Line-54N.
NAKATSUKA ET AL.: DOC AND POC IN THE SEA OF OKHOTSK
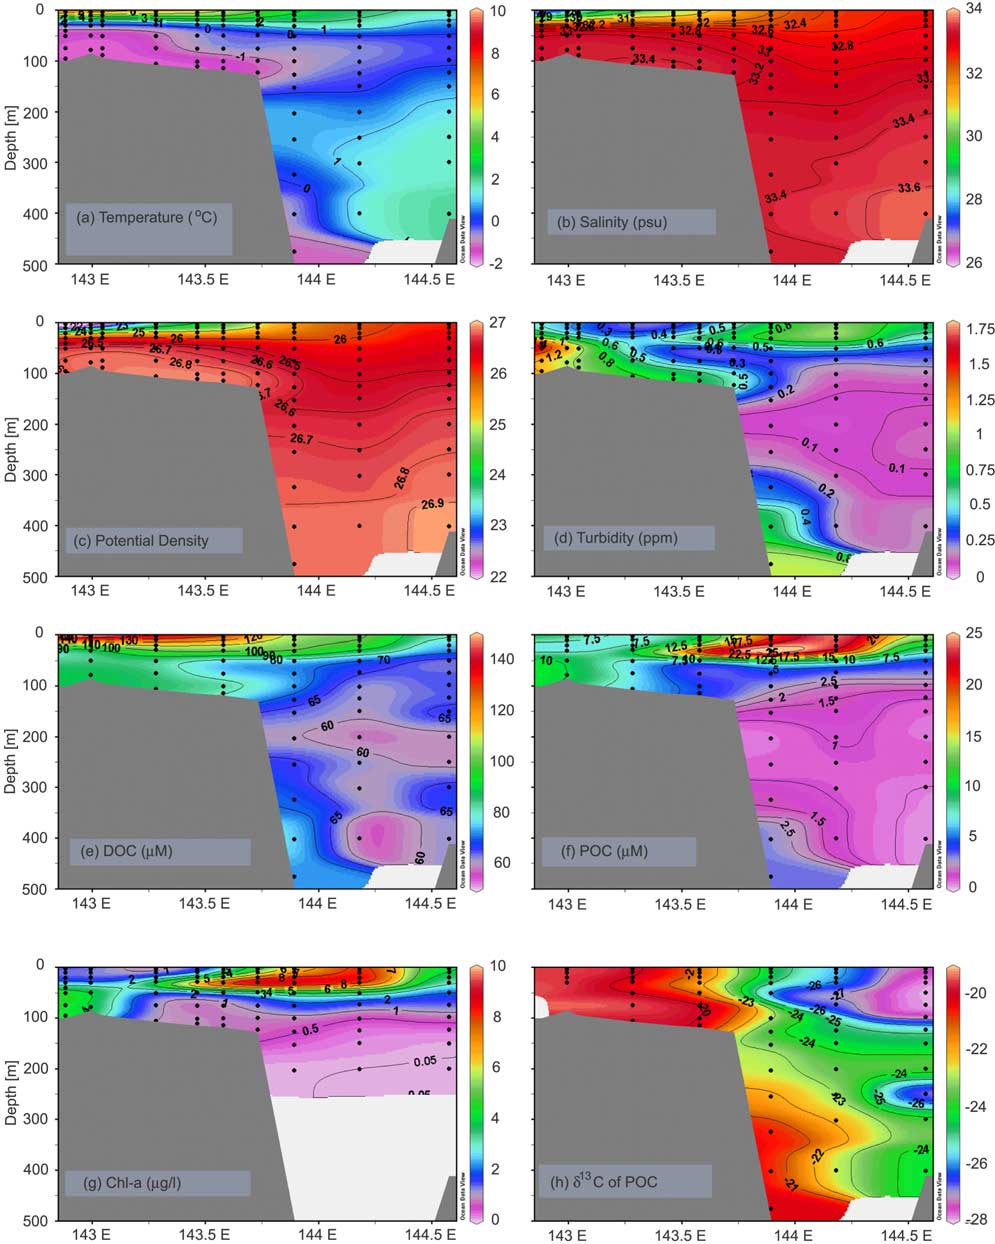
Vertical sections of (a) temperature, (b) salinity, (c) potential density, (d) turbidity,
(e) dissolved organic carbon (DOC), (f) particulate organic carbon (POC), (g) Chl-a, and (h) stable carbonisotopic ratio (d13C) of POC along Line-NE.
NAKATSUKA ET AL.: DOC AND POC IN THE SEA OF OKHOTSK
near the surface, which induces the increase in temperaturein the uppermost layer (Figure 2a). This fresh surface waterhas a very large amount of DOC (Figure 2e), which musthave originated from the river water, while the POCconcentration of this water mass is not larger than thesubsurface layer on the slope area (Figure 2f). The Chl-aconcentration has its maximum value, more than 9 mg/L, atthe subsurface layer on the slope area, showing the presenceof the phytoplankton bloom at the time of water samplingthere (Figure 2g). POC also has its maximum value atthe same position of the phytoplankton bloom, while DOCshows a significant but very small increase at this position.
These correlations between DOC, POC, and Chl-a suggestthat POC is produced mainly by marine organisms; how-ever, most of the DOC in this area originates from riverwater.
[20] On Line-NE (Figure 3), the characteristics are
principally the same for the distributions of physical andchemical properties as those in Line-54N describedabove. The cold water masses, which have the densityrange from 26.7 to 26.9 sq, are located on the shelf andthe slope (Figures 3a and 3c). Both water masses have high
Vertical profiles of (a) temperature, (b) potential
turbidity (Figure 3d) and high concentrations of DOC and
density, (c) POC and Chl-a, and (d) d13C of POC at site 82.
POC (Figures 3e and 3f), and the d13C of POC is higher than
20% in the two water masses.
[21] In the surface layer, a low-salinity water mass exists
POC are distinctly higher than in the surrounding water
at the site closest to the coast (Figure 3b), which has very
mass (Figures 2e and 2f). Chl-a concentration in the cold
high DOC concentration (Figure 3e). As in Line-54, Chl-a
intermediate water is also significantly higher than in the
and POC have their maximum values at the subsurface layer
pelagic water at the same depth level, suggesting a rapid
above the slope region (Figures 3f and 3g). Interestingly, the
outflow of DSW from the continental shelf together with
d13C at the maximum center of POC is very low (< 24%)
fresh biogenic particles (Figure 2g). The distribution in d13C
(Figure 3h), indicating the effect of low growth rate for the
of POC shows a tight linkage of the POC between the DSW
carbon isotope fractionation during the photosynthesis there
and the cold intermediate water mass (Figure 2h). POC in
[Nakatsuka et al., 1992]. This distinct difference in the d13C
both water masses has a much higher d13C value (> 22%)
of POC between the shelf and the pelagic areas may be
than in pelagic waters, indicating that the POC in the cold
useful in determining the origin of POC in the western
intermediate water has actually come from the bottom of the
region of the Sea of Okhotsk.
continental shelf.
[18] Because the main area of sea ice production is the
Sources of DOC and POC in Surface and
wide continental shelf region along the Siberian coast
Subsurface Waters
[Alfultis and Martin, 1987; Kimura and Wakatsuchi,
[22] There are usually two major sources for DOC and
2000] (Figure 1) and a strong anticlockwise current system
POC in the area near large river mouths such as the present
exists in the Sea of Okhotsk [Ohshima et al., 2002]
study area. One is the in situ phytoplankton production. The
(Figure 1), the DSW on the narrow shelf and the discharged
other is the input of terrestrial organic matter from the river.
DSW found on the slope in Line-54N must have been
Figures 5a and 5b show the relationships between DOC,
transported from the continental shelf in the northwestern
POC, and Chl-a concentrations in 0- to 200-m depths
region of the Sea of Okhotsk. Water with DSW character-
analyzed in this study, respectively. Although there is a
istics does exist in the bottom layer on the shelf region
clear linear relationship between POC and Chl-a (Figure 5b),
northwestward of the Sakhalin Island (Figure 4). This water
indicating that the major source of POC is the phytoplank-
has the same physical and chemical characteristics as the
ton production in this area, there are two different patterns
DSW and the discharged DSW found on Line-54N.
in the distribution of DOC and Chl-a (Figure 5a), according
[19] As for the surface water in Line-54N, the low-
to the salinity range. In the high-salinity waters of more
salinity water is distributed along the coast (Figure 2b),
than 32 psu, there is a positive correlation between DOC
and must have been discharged from the Amur River mouth
and Chl-a, suggesting a contribution of phytoplankton to
and transported beyond the northern end of the Sakhalin
the in situ DOC production. However, we can also find
Island. Because the strong western boundary current, namely
another correlation between DOC and Chl-a with much
the East Sakhalin Current, flows southward on Line-54N,
larger DOC and smaller Chl-a concentrations in the low
the low-salinity water is distributed being attached to the
salinity waters of less than 32 psu, indicating the different
coast. The low salinity reduces the density of this surface
source of DOC, i.e., terrestrial organic matter input from the
water mass (Figure 2c) and develops the water stratification
NAKATSUKA ET AL.: DOC AND POC IN THE SEA OF OKHOTSK
Relationship between Chl-a concentration and (a) DOC and (b) POC in the surface and
subsurface waters (0 – 200 m) analyzed in this study. Solid and open circles in Figure 5a indicate thesamples with salinity ranges less and more than 32 psu, respectively. Solid and dashed lines in Figure 5ashow the linear regression of data with salinity ranges less and more than 32 psu, respectively. Solid linein Figure 5b indicates the linear regression of all the data.
[23] The Amur River water must affect the water mass in
[25] In contrast to the DOC, the POC has a relatively weak
the area around Station 86 because the water discharged
correlation with salinity in the surface layer (Figure 7b). The
from the Amur River first flows northward along the
water collected near the Amur River mouth has the highest
northwestern coast of Sakhalin Island before turning to
POC value, however, and increases at the high-salinity
the south beyond the northern end of the Island. Actually,
range, too. The simultaneous increases of both POC and
a very low-salinity water, of less than 20 psu, spreads over
Chl-a near the river mouth (Figure 6c) suggest that marine
this station (Figure 6). In the surface layer, DOC exceeds
organisms must produce most of the POC in the western
300 mM, which is 3 times higher than that in the pelagic
region of the Sea of Okhotsk.
surface water. In this water mass, POC is also very high.
[26] Because the Amur River water contains large amounts
However, this increase in POC may not consist of POC
of nutrients, especially silicate [Nakatsuka et al., 2004], the
discharged from the Amur River, because d13C of the POC
Amur River discharge must increase the productivity of
is higher ( 20%) at this surface water than the typical d13C
phytoplankton such as diatom in the Sea of Okhotsk. In fact,
values of terrestrial C3 plants (usually less than
the areas near the Amur river mouth and off the northeast
[Sternberg et al., 1984], which are the dominant vegetation
coast of Sakhalin are known to have the largest biological
in the Amur River basin, and high POC concentration isaccompanied by a large amount of Chl-a, too, whichsuggests the occurrence of a phytoplankton bloom there.
Therefore the Amur River water is thought not to supplylarge amounts of POC into the Sea of Okhotsk, but ratherinduces a phytoplankton bloom through the input of majornutrients or micronutrients, although the DOC actuallyseems to be discharged from the river.
[24] The very good linear correlation between salinity and
DOC in the surface layer in the study area (Figure 7a)provides important information about DOC in this region.
First, large amounts of DOC are supplied to the region fromthe Amur River. According to the y-intersection of theregression line, Amur River water contains 690 mM ofDOC. This value is much higher than the DOC of riverwater in temperate regions and is comparable to river waterin the polar region of northern Siberia [Lara et al., 1998].
Multiplying the annual amount of Amur River discharge(300 km3), 2.5 Tg/yr of terrestrial DOC is estimated to beexported into the northwestern region of the Sea ofOkhotsk. Second, the high linearity of the regression line(r = 0.99) indicates the conservative nature of the terrestrialDOC. Because conifer forests occupy the catchment area ofthe Amur River, the DOC in the river water should becomposed primarily of refractory humic substances origi-nating from forests [Spitzy and Leenheer, 1991]. Third,marine organisms in this region affect the DOC concentra-
Vertical profiles of (a) temperature and salinity,
tion in the surface layer to a very limited degree.
(b) DOC, (c) POC and Chl-a, and (d) d13C of POC at site 86.
NAKATSUKA ET AL.: DOC AND POC IN THE SEA OF OKHOTSK
Relationship between salinity and (a) DOC and (b) POC in the surface layer (0 – 5 m) over the
studied area. Solid line in Figure 7a indicates the linear regression of all the data.
productivity in the Sea of Okhotsk [Sorokin and Sorokin,
which is equivalent to that of the DSW and the cold
1999; Saitoh et al., 1996], suggesting a direct effect from the
intermediate water derived from the DSW, observed at
Amur River water.
stations in the outer shelf and slope regions (bottom depthsare >100 m). There are strong negative correlations with
Export of DOC and POC From the Shelf Bottom
carbon, particularly with POC (Figure 8b), indicating that the
to the Intermediate Water
DSW that is rich in organic carbon is discharged from the
[27] The high DOC and POC concentrations in the cold
shelf to the slope area and mixed with the warmer pelagic
intermediate layer attached to the slope (Figures 2e, 2f, 3e,
intermediate water, which contains less organic carbon. The
and 3f) suggest that a large amount of organic carbon is
high linearity between the POC and temperature in the
transported from the continental shelf to the ocean interior
intermediate density range suggests that POC acts as a
due to the DSW outflow, because a large volume of DSW on
conservative component in the intermediate layer near the
the shelf is actually transported outward from the shelf every
slope and can be transported farther from the shelf edge into
year by the East Sakhalin Current and/or as a density flow due
the open sea. Because the living and/or very fresh POC are
to a high density of the DSW itself [Mizuta et al., 2003;
generally decomposed very quickly, the apparent conserva-
Fukamachi et al., 2004]. The high d13C values of POC in the
tive property of POC in the intermediate layer suggests the
intermediate layer (Figures 2 and 3) indicate that most of the
very fast transport of DSW into the intermediate layer on the
POC transported into the intermediate layer was originally
slope [Mizuta et al., 2003] and/or the nonliving and refrac-
produced on the continental shelf by phytoplankton, although
tory nature of POC in the intermediate layer probably
we cannot estimate the proportion of marine and terrestrial
originating from the sedimentary particles, which contain
components in the DOC flowing into the intermediate layer
highly degraded residues of marine organisms, on the shelf
due to the lack of d13C data of DOC at present.
[Nakatsuka et al., 2002]. The fact that a significantly higher
[28] Here we attempt to estimate the amount of organic
concentration of Chl-a was detected at the intermediate layer
carbon flux and discuss its implication for the biogeochem-
on the slope (Figure 2g) supports the former process, but the
ical cycle in the Sea of Okhotsk. Figure 8 shows the relation-
ratio of Chl-a concentrations on the slope (approximately
ships between the DOC and POC concentrations and
0.05 mg/L) to that on the shelf (0.5 – 1 mg/L) (Figure 2g) is
the temperature in the density range from 26.7 to 27.0 sq,
much smaller than the ratio of POC between the slope
Relationship between the temperature and (a) DOC and (b) POC in a density range from 26.7
to 27.0 sq on the outer shelf and the slope areas, where the bottom depths are larger than 100 m. Solidlines indicate the linear regression of all the data.
NAKATSUKA ET AL.: DOC AND POC IN THE SEA OF OKHOTSK
(approximately 2 mM) and the shelf (3 – 7 mM), suggestingthat the fresh POC consists of a small portion of total POCdischarged from the shelf to the slope region.
[29] If the temperature of DSW flowing out from the shelf
1.5�C, the concentrations of DOC and
POC in the DSW discharged from the shelf can be estimatedas 72.8 mM and 4.8 mM, respectively (Figure 8). Multiply-ing a previously reported flux of DSW outflow from theshelf to the intermediate layer (0.5 Sv) [Itoh et al., 2003;Gladyshev et al., 2000], we can estimate the annual flux ofthe DOC and POC from the shelf to the ocean interior in theSea of Okhotsk as 13.6 TgC and 0.9 TgC, respectively.
[30] In order to clarify the potential influence of these
DOC and POC fluxes for the biogeochemical cycle in theocean interior in the Sea of Okhotsk, we try to comparethose fluxes with that of sinking POC flux measured by thesediment trap experiments [Nakatsuka et al., 2004]. Foursediment traps were moored at two sites, which werelocated approximately 150 km offshore from the northeastcoast of the Sakhalin Island at 54�N and 49.5�N, respec-tively. At both sites, one of the two sediment traps mooredcloser to the bottom recorded the intermittent lateral input of
Fluxes of organic carbon into the intermediate
lithogenic particles, which originate from the DSW outflow
layer off the east coast of Sakhalin Island. Inverted triangles
[Nakatsuka et al., 2004]. Therefore the POC and DOC
on the map show the positions of sediment trap measuring
discharged from the shelf due to the DSW outflow must also
the sinking POC flux [Nakatsuka et al., 2004].
spread over these sediment trap sites, although most of theexported DOC and POC appear to flow southward along thecontour lines under the influence of a western boundary
[32] This rough calculation inevitably indicates that the
current, namely the East Sakhalin Current. Here we assume
DSW outflow must affect the biogeochemical cycle in
that most of the POC exported with the DSW are deposited
the western region of the Sea of Okhotsk, particularly the
or decomposed in an area off the east coast of north
heterotrophic organisms in the intermediate layer of this
Sakhalin (from 55�N to 49�N and within 300 km of the
region. Sorokin and Sorokin [1999] found an extraordinarily
coastal line), and calculate the budget of organic carbon in
abundant microbial biomass in the intermediate layer of this
the intermediate layer of this area.
area. Nimmergut and Abelmann [2002] also reported the
[31] Because the area is 180,000 km2 and the sinking
existence of a unique assemblage and highly populated
POC flux monitored at the upper trap depth (260 – 280 m) of
biomass of radiolarian, a kind of zooplankton, in the
the two stations were from 1.1 to 2.7 gC/m2/yr, the annual
intermediate water depth in this area. The POC and DOC
load of sinking POC from the surface water to the interme-
export accompanied with the DSW outflow from the shelf to
diate layer can be calculated as 0.2 – 0.5 TgC/yr (Figure 9).
the intermediate water can explain the unique characteristics
These values are much smaller than the lateral DOC and
of heterotrophy in the intermediate water of the Sea of
POC fluxes of 13.6 TgC/yr and 0.9 TgC/yr into the
Okhotsk. Because the same types of dense water outflow
intermediate layer of this area from the northwestern con-
from the shelf to the ocean interior exist in seasonally ice-
tinental shelf (Figure 9). Of course, parts of the DOC from
covered areas all over the world, the accompanying organic
the shelf must have already become refractory when dis-
matter transport may also affect the intermediate water
charged with the DSW, and most of the DOC may pass
ecosystem in the world oceans.
through the intermediate layer of the area off Sakhalin
[33] The discharged DSW is transported southward along
without being consumed by intermediate dwelling orga-
the intermediate layer of the Sea of Okhotsk, and finally
nisms. However, Figure 8a shows that there is an approx-
flows out into Pacific Ocean through Bussol' Strait in Kuril
imately 10 mM difference in DOC concentrations between
archipelago. This intermediate water mass is further trans-
the DSW and the pelagic intermediate waters. Therefore we
ported southward on the southeast of Kuril archipelago and
infer that in the total DOC outflow of 13.6 Tg/yr, the
Hokkaido Island of northern Japan, and joins to the forma-
fraction that can be consumed in the intermediate water of
tion of the NPIW at the region off northeastern Japan
this area is approximately 2 Tg/yr, which is nevertheless
[Yasuda et al., 1996; Talley, 1997]. Therefore the injection
much higher than the sinking POC flux from the surface
of a large amount of DOC in the northwestern region of the
layer in this area (Figure 9). In the Sea of Okhotsk, primary
Sea of Okhotsk may finally cause the increase in DOC in
production is highest on the northwestern continental shelf
the NPIW. This possibility has been suggested in a previous
region [Saitoh et al., 1996], probably due to the river water
study of the Pacific Ocean [Hansell et al., 2002], which
input and the effective nutrient recovery from the shallow
discussed the reason for the westward decrease in the 14C
water bottom. The high productivity on the shelf, therefore,
ages of DOC in NPIW [Bauer and Druffel, 1998]. If the
can support the lateral supply of large amounts of organic
organic carbon discharged from the northwest continental
matter into the intermediate layer of the adjacent pelagic
shelf in the Sea of Okhotsk actually increases the DOC in
region through the DSW outflow.
NPIW, then the organic carbon must have a great impact on
NAKATSUKA ET AL.: DOC AND POC IN THE SEA OF OKHOTSK
biogeochemical cycles not only in the Sea of Okhotsk but
Gladyshev, S., S. Martin, S. Riser, and A. Figurkin (2000), Dense water
also in the wider area of the North Pacific Ocean.
production on the northern Okhotsk shelves: Comparison of ship-basedspring-summer observations for 1996 and 1997 with satellite observa-tions, J. Geophys. Res., 105, 26,281 – 26,299.
Hansell, D. A., C. A. Carlson, and Y. Suzuki (2002), Dissolved organic
carbon export with North Pacific Intermediate Water formation, Global
Biogeochem. Cycles, 16(1), 1007, doi:10.1029/2000GB001361.
The vertical and horizontal distributions of DOC and
Itoh, M., K. I. Ohshima, and M. Wakatsuchi (2003), Distribution and
POC around the north of Sakhalin Island indicated two
formation of Okhotsk Sea Intermediate Water: An analysis of isopycnal
predominant mechanisms, which characterize the organic
climatological data, J. Geophys. Res., 108(C8), 3258, doi:10.1029/
carbon cycles in the western region of the Sea of Okhotsk.
Kimura, N., and M. Wakatsuchi (2000), Relationship between sea-ice
One of these mechanisms is the input of a large amount of
motion and geostrophic wind in the Northern Hemisphere, Geophys.
terrestrial DOC from the Amur River into this region. The
Res. Lett., 27, 3735 – 3738.
Amur River water contains approximately 700 mM DOC,
Kitani, K. (1973), An oceanographic study of the Sea of Okhotsk, particu-
which is refractory and may consist of humic substances,
larly in regard to cold waters, Bull. Far Seas Fish. Res. Lab., 9, 45 – 77.
Kowalik, K., and I. Polyakov (1998), Tides in the Sea of Okhotsk, J. Phys.
and the annual load of DOC from the Amur was estimated
Oceanogr., 28, 1389 – 1409.
as 2.5 TgC. Because of the high nutrient contents in the
Lara, R. J., V. Rachold, G. Kattner, H. W. Hubberten, G. Guggenberger,
Amur River water, the Amur River discharge may play an
A. Skoog, and D. N. Thomas (1998), Dissolved organic matter andnutrients in the Lena River, Siberian Arctic: Characteristics and distribu-
important role in increasing the biological productivity in
tion, Mar. Chem., 59, 301 – 309.
the Sea of Okhotsk. The other mechanism is the discharge
Martin, S., R. Drucker, and K. Yamashita (1998), The production of ice and
of DOC and POC, including fresh organic matter such as
dense shelf water in the Okhotsk Sea polynyas, J. Geophys. Res., 103,27,771 – 27,782.
Chl-a, from the bottom of the shelf to the ocean interior due
Mizuta, G., Y. Fukamachi, K. I. Ohshima, and M. Wakatsuchi (2003),
to the DSW outflow into the pelagic intermediate layer. The
Structure and seasonal variability of the East Sakhalin Current, J. Phys.
estimation of these lateral inputs from the shelf indicated
Oceanogr., 33, 2430 – 2445.
that the intermediate layer of the region off the east coast of
Nakatsuka, T., N. Handa, E. Wada, and C.-S. Wong (1992), The dynamic
changes of stable isotopic ratios of carbon and nitrogen in suspended and
Sakhalin receives a much greater amount of organic matter
sedimented particulate organic matter during a plankton bloom, J. Mar.
from the adjacent shelf than from the in situ surface water.
Res., 50, 267 – 296.
This curious situation is supported by the high biological
Nakatsuka, T., C. Yoshikawa, M. Toda, K. Kawamura, and M. Wakatsuchi
(2002), An extremely turbid intermediate water in the Sea of Okhotsk:
productivity in the northwestern continental shelf region of
Implication for the transport of particulate organic carbon in a season-
the Sea of Okhotsk [Saitoh et al., 1996] and the outflow of
ally ice-bound sea, Geophys. Res. Lett., 29(16), 1757, doi:10.1029/
DSW under the influences of the sea-ice formation and the
Nakatsuka, T., T. Fujimune, C. Yoshikawa, S. Noriki, K. Kawamura,
East Sakhalin Current [Mizuta et al., 2003; Fukamachi et
Y. Fukamachi, G. Mizuta, and M. Wakatsuchi (2004), Biogenic and
al., 2004]. This characteristic system for organic matter
lithogenic particle fluxes in the western region of the Sea of Okhotsk:
transport in this area can explain the reported extraordinary
Implications for lateral material transport and biological productivity,
features of heterotrophic organisms living in the intermedi-
J. Geophys. Res., doi:10.1029/2003JC001908, in press.
Nimmergut, A., and A. Abelmann (2002), Spatial and seasonal changes of
ate layer of the Sea of Okhotsk [Sorokin and Sorokin, 1999;
radiolarian standing stocks in the Sea of Okhotsk, Deep Sea Res., Part I,
Nimmergut and Abelmann, 2002]. Previous studies on the
49, 463 – 493.
distributions in 14C ages of DOC in NPIW have predicted a
Ohshima, K. I., M. Wakatsuchi, Y. Fukamachi, and G. Mizuta (2002), Near-
surface circulation and tidal currents of the Okhotsk Sea observed with
possible input of a large amount of fresh organic matter into
the satellite-tracked drifters, J. Geophys. Res., 107(C11), 3195,
the Pacific Ocean from the Sea of Okhotsk through the
intermediate layer [Hansell et al., 2002]. Our present result,
Saitoh, S., M. Kishino, H. Kiyofuji, S. Taguchi, and M. Takahashi (1996),
Seasonal variability of phytoplankton pigment concentration in the
therefore, might be an answer to the questions presented by
Okhotsk Sea, J. Remote Sens. Soc. Jpn., 16, 86 – 92.
the organic carbon studies in the NPIW.
Sorokin, Y. I., and P. Y. Sorokin (1999), Production in the Sea of Okhotsk,
J. Plankton Res., 21, 201 – 230.
Spitzy, A., and J. Leenheer (1991), Dissolved organic carbon in rivers, in
We greatly acknowledge all of the scientists,
Biogeochemistry of Major World Rivers, edited by E. T. Degens,
technicians, captain, and crews of R/V Professor Khromov (Far Eastern
S. Kempe, and J. E. Richey, pp. 213 – 232, John Wiley, Hoboken, N. J.
Regional Hydrometeorological Research Institute in Vladivostok, Russia)
Sternberg, L., M. J. DeNiro, and H. B. Johnson (1984), Isotope ratios of
during the cruises of XP00 in the Sea of Okhotsk for their efforts in
cellulose from plants having different photosynthetic pathways, Plant
collecting water samples. Thanks are also due to L. Talley for her support in
Physiol., 74, 557 – 561.
producing the CTD and nutrient data and to S. Saitoh for the measurement
Talley, L. D. (1991), An Okhotsk Sea Water anomaly: Implications for
of pigments. In addition, we are grateful to the two anonymous reviewers
ventilation in the North Pacific, Deep Sea Res., Part I, 38, S171 – S190.
for their helpful comments regarding the improvement of our manuscript.
Talley, L. D. (1997), North Pacific Intermediate Water transports in the
This study was financially supported by a fund from Core Research for
mixed water region, J. Phys. Oceanogr., 27, 1795 – 1803.
Evolutional Science and Technology (CREST), Japan Science and Tech-
Wong, C. S., R. J. Matear, H. J. Freeland, F. A. Whitney, and A. S. Bychkov
nology Corporation.
(1998), WOCE line P1W in the Sea of Okhotsk: 2. CFCs and theformation rate of intermediate water, J. Geophys. Res., 103, 15,625 –
Agatova, A. I., E. V. Danfner, V. V. Sapozhnikov, N. I. Torgunova, and
Yasuda, I., K. Okuda, and Y. Shimizu (1996), Distribution and modification
T. K. Ukolova (1996), Investigations of dissolved and suspended organic
of North Pacific Intermediate Water in the Kuroshio-Oyashio Interfrontal
matter distribution in the Sea of Okhotsk, Oceanology, 36, 856 – 864.
Zone, J. Phys. Oceanogr., 26, 448 – 465.
Alfultis, M. A., and S. Martin (1987), Satellite passive microwave studies
of the Sea of Okhotsk ice cover and its relation to oceanic processes,1978 – 1982, J. Geophys. Res., 92, 13,013 – 13,028.
Bauer, J. E., and E. R. M. Druffel (1998), Ocean margins as a significant
K. Kawamura, T. Nakatsuka, and M. Wakatsuchi, Institute of Low
source of organic matter to the deep open ocean, Nature, 392, 482 – 485.
Temperature Science, Hokkaido University, N19 W8, Kita-ku, Sapporo
Fukamachi, Y., G. Mizuta, K. I. Ohshima, L. D. Talley, S. C. Riser, and
060-0819, Japan. ([email protected]; nakatuka@lowtem.
M. Wakatsuchi (2004), Transport and modification processes of dense
shelf water revealed by long-term moorings off Sakhalin in the Sea of
M. Toda, Graduate School of Environmental Earth Science, Hokkaido
Okhotsk, J. Geophys. Res., 109, C09S10, doi:10.1029/2003JC001906.
University, N10 W5, Kita-ku, Sapporo 060-0810, Japan.
Source: http://www.isc.chubu.ac.jp/kawamura/saishin.pdf/nakatsuka2004jgr2.pdf
Case Study Dr. Tabitha Ndungu presented to NACADA on their 2nd Conference in Nairobi, Kenya Date; 10th - 14th JUNE 2013 Venue: Moi Sports Centre Kasarani Gymnasium Theme: " The Youth and Drugs: A Call to Action." In spite of the damage done by
The International Journal Of Humanities & Social Studies (ISSN 2321 - 9203) www.theijhss.com THE INTERNATIONAL JOURNAL OF HUMANITIES & SOCIAL STUDIES Sacred Power of Menstruation versus Cultural Myths: An Interdisciplinary Overview Bhumika Sharma Assistant Professor, LR Group of Institutes, Solan, HP, India