Untitled


BMJ 2012;344:e615 doi: 10.1136/bmj.e615 (Published 2 March 2012)
Cost effectiveness of strategies to combat vision and
hearing loss in sub-Saharan Africa and South East
Asia: mathematical modelling study
Rob Baltussen senior researcher 1, Andrew Smith honorary professor 2
1Department of Primary and Community Care, Radboud University Nijmegen Medical Center, PO Box 9101 6500HB Nijmegen, The Netherlands;2Centre for Disability and Development, London School of Hygiene and Tropical Medicine, London, UK
relation to the economic attractiveness of other, existing or new,
Objective To determine the relative costs, effects, and cost effectiveness
interventions in health.
of selected interventions to control cataract, trachoma, refractive error,
hearing loss, meningitis and chronic otitis media.
Design Cost effectiveness analysis of or combined strategies for
Throughout the world, loss of vision and hearing are a major
controlling vision and hearing loss by means of a lifetime population
burden. More than 284 million people are visually impaired, of
whom 245 million have low vision and 39 million are blind.1
Setting Two World Health Organization sub-regions of the world where
Some 278 million people worldwide have moderate or greater
vision and hearing loss are major burdens: sub-Saharan Africa and
hearing impairment.2-5 The number of people worldwide with
South East Asia.
sensory deficits is rising mainly due to a growing global
population and longer life expectancies. More than 90% of the
Data sources Biological and behavioural parameters from clinical and
world's visually impaired people and 80% of hearing impaired
observational studies and population based surveys. Intervention effects
people live in low and middle income countries.1 6
and resource inputs based on published reports, expert opinion, and theWHO-CHOICE database.
Cataract is the leading cause of visual impairment globally,
followed by glaucoma. The most common type of hearing
Main outcome measures Cost per disability adjusted life year (DALY)
impairment is sensorineural hearing loss (with common causes
averted, expressed in international dollars ($Int) for the year 2005.
advanced age and noise exposure), followed by conductive
Results Treatment of chronic otitis media, extracapsular cataract surgery,
hearing impairment (with leading cause chronic otitis media).
trichiasis surgery, treatment for meningitis, and annual screening of
Globally, up to 75% of all vision loss and 50% of hearing loss
schoolchildren for refractive error are among the most cost effective
interventions to control hearing and vision impairment, with the cost per
For this reason, global initiatives have set targets and indicators
DALY averted <$Int285 in both regions. Screening of both schoolchildren
related to the reduction of vision and hearing impairment, with
(annually) and adults (every five years) for hearing loss costs around
special reference to low and middle income countries. VISION
$Int1000 per DALY averted. These interventions can be considered
2020, the global initiative for the elimination of avoidable
highly cost effective. Mass treatment with azithromycin to control
blindness, aims to eliminate avoidable blindness by the year
trachoma can be considered cost effective in the African but not the
2020 and prevent the projected doubling of avoidable visual
South East Asian sub-region.
impairment between 1990 and 2020.7 WWHearing (World-Wide
Conclusions Vision and hearing impairment control interventions are
Hearing Care for Developing Countries) aims to eliminate much
generally cost effective. To decide whether substantial investments in
of avoidable hearing loss by 2020 through a new initiative called
these interventions is warranted, this finding should be considered in
Correspondence to: R Baltussen [email protected]
Extra material supplied b)
General appendix (referred to by all the papers in this cluster)Appendices A–C: Details of (A) definitions of interventions, disease models, and resource use patterns; (B) costs, health effects, and cost effectivenessof all interventions; (C) probabilistic uncertainty analyses for interventions
No commercial reuse: See rights and reprints
BMJ 2012;344:e615 doi: 10.1136/bmj.e615 (Published 2 March 2012)
For many countries, it is not evident that these targets will be
achieved at current rates of progress, despite a wide range of
Table shows the set of 87 analysed interventions (and
effective interventions to prevent, detect, and manage visual
combinations of interventions) to control cataract, trachoma,
and hearing impairment. A key question, therefore, is whether
refractive error, hearing loss, meningitis, or chronic otitis media.
the correct mix of interventions is currently being used, and
We carefully selected the interventions on their relevance for
what strategies should be scaled up if additional funds would
disease control but were also limited by the lack of data on
become available. Cost and cost effectiveness analyses can
burden of disease or intervention effectiveness. Some
provide valuable inputs to these decisions by identifying the
interventions that have relatively recently been developed were
most efficient ways of delivering prevention, diagnosis, and
not subjected to analyses. The resulting set of interventions is
treatment services at different levels of resource availability.
therefore somewhat arbitrary and not meant to cover all
Several studies have reported on the global and regional cost
potentially available interventions to reduce hearing and vision
effectiveness of interventions targeting cataract,9 trachoma,10
loss in sub-Saharan Africa and South East Asia. For example,
refractive error,11 and different causes of hearing impairment.12
in trachoma control we evaluated antibiotic treatment and
However, studies have been carried out in isolation, which
surgery but not promotion of face washing. Likewise, in cataract
prevents the cost effectiveness of the different interventions
control, we evaluated extracapsular cataract extraction but not
being directly compared. In addition, the studies used
small incision cataract surgery or phacoemulsification. In control
demographics and price levels for the year 2000.
of hearing impairment, we did not evaluate education,
Now, a decade past 2000, and in the realm of the global
rehabilitation, and noise conservation programmes, nor neonatal
initiatives, an up to date assessment of the cost effectiveness of
screening, surgical interventions, or cochlear implants.
vision and hearing impairment control strategies is needed. In
Interventions on glaucoma were also not evaluated. All
this paper we address the question of what are the costs and
interventions are defined in appendix A on bmj.com.
effects of prevention, early detection, management, and
All interventions were analysed at WHO-CHOICE standardised
rehabilitation of visual and hearing impairment, both singly and
geographic coverage levels of 50%, 80%, and 95%, referring
in combination. Our analysis is based on a consistent
to the percentage of eligible cases receiving treatment. These
methodological approach and a generic measure of effectiveness
levels may not always be feasible, but are nevertheless reported
and covers two geographical settings, in Asia and Africa.
here to show the presence of important (dis)economies of scale
when varying the number of people covered.
Estimating health effects
The starting point of our analysis of health effects was the
Cost effectiveness analysis can be undertaken in many ways,
identification of best available evidence on the (clinical or
and there have been several attempts to develop methodological
population) effectiveness of interventions. Ideally, we retrieved
guidelines to make results more comparable. In its
this evidence from Cochrane reviews (such as on the
WHO-CHOICE project, the World Health Organization has
effectiveness of cataract surgery), but in other instances we used
developed a standardised set of methods and tools that can be
evidence from individual studies (such as on the effectiveness
used to analyse the societal costs and effectiveness of current
of azithromycin in trachoma control). Where no evidence was
and possible new interventions simultaneously.13 14 The project
available, we based our estimate of effectiveness on expert
is designed to provide regularly updated databases on the costs
opinion (such as on levels of compliance in wearing hearing
and the effects of a full range of promotive, preventive, curative,
aids or glasses). We used evidence on intervention effectiveness
and rehabilitative health interventions.
pertaining to the regions under study or extrapolated this from
Western settings where meaningful (as for antibiotic treatment
for meningitis). All sources of data of intervention effectiveness
Most countries do not have the capacity to evaluate all potential
for screening interventions for uncorrected refractive error are
interventions for improving given health indicators at the
listed in table 3, and those for the other disease areas are listed
national and the sub-national level, and global estimates are too
in the appendices on bmj.com.
general and of little use to any specific country. However,
All analyses used population model PopMod19 to translate this
countries may benefit from regional evaluations of data, where
intervention effectiveness into a generic measure of health
data of neighbouring countries with similar settings are pooled.
effects. More specifically, it combines incidence, prevalence,
The present analysis drew on a comprehensive examination of
and mortality data for the relevant causes of vision and hearing
14 world sub-regions defined by geographical proximity and
impairment with the standard health state valuations20 to estimate
epidemiology according to WHO classification. In common
the population impact of the different scenarios in terms of
with other papers in this series, we evaluated interventions for
healthy years lived.14 Following standardised WHO-CHOICE
two major global regions using a standardised analytical
cost effectiveness analysis, we evaluated all interventions for a
approach. The two regions are referred to as sub-Saharan Africa,
period of 10 years, and ran model for the length of time
including those African countries with very high adult and high
necessary for all people affected by the interventions to have
child mortality (referred to as AfrE in the WHO classification),
died (that is, some 100 years in both regions, following the use
and South East Asia, including those countries in Asia with high
of regional mortality rates18). The difference between the healthy
adult and high child mortality (referred to as SearD).15 The
years lived in each intervention scenario and the no intervention
prevalence of vision and hearing impairment globally and for
scenario is the health gain of the intervention, or the number of
these two regions is summarised in table (based on Resnikoff
disability adjusted life years (DALYs) averted. A general
et al16 17 and Mathers18).
description of the population model is provided in the general
appendix on bmj.com, and details of the different disease models
are available in appendix A on bmj.com.
No commercial reuse: See rights and reprints
BMJ 2012;344:e615 doi: 10.1136/bmj.e615 (Published 2 March 2012)
both more effective and less costly than other interventions. We
The analysis follows standardised WHO-CHOICE guidelines
then calculated the incremental cost effectiveness ratio for those
on costing analysis, and estimates patient level costs and
resulting interventions by dividing the incremental costs by the
programme level costs from the societal perspective. Patient
incremental health effects. The economic attractiveness of an
level costs are all costs incurred at the level of contact between
intervention within its disease area is reflected by this
the provider and the individual patient. The quantities of
incremental cost effectiveness ratio: the lower the incremental
resources required in terms of diagnostic tests, drug use, and
cost per DALY averted, the more economically attractive an
health centre visits for supervision and monitoring and
intervention is. Thirdly, we compared resulting interventions
hospitalisation for each of the interventions were based on WHO
across disease areas on the basis of their incremental cost
treatment protocols and expert opinion of actual practice. Drug
effectiveness ratios and ranked them accordingly. The
costs were based on international drug prices21 with a mark up
interventions with the lowest incremental cost effectiveness
for international and local transportation costs.22 23 Unit costs
ratio are ranked highest and are economically most attractive.
of health centre visits and hospital inpatient days were based
WHO-CHOICE defines interventions that have an incremental
on econometric analysis by Adam et al,24 while those for
cost effectiveness ratio of less than the gross domestic product
laboratory tests and x rays were based on the best available
(GDP) per capita as very cost effective, and those with a ratio
international cost information included in WHO-CHOICE's
less than three times the GDP per capita as cost effective. The
costing database. Unit costs were combined with resource use
regions studied here have a GDP of around $Int2000 per capita,30
patterns to estimate the cost per patient treated. Total patient
which means that interventions costing <$Int2000 per DALY
costs were then calculated as the cost per patient treated
averted can be considered very cost effective and those costing
multiplied by the number of patients treated (calculated as the
between $Int2000 and $Int6000 can be considered cost effective.
annual incidence of disease from the model multiplied by the
Other interventions are considered not cost effective.
relevant coverage level and then by the percentage of cases
diagnosed and treated in covered areas). The costs of screening
interventions to detect hearing and vision impairment not only
All interventions are imbued with a certain degree of uncertainty.
include the costs of the screening activities but also costs of
To handle this aspect of reporting for such a wide range of
hearing aids and glasses for those who need them.
interventions, we classified interventions according to their
Programme level costs relate to the resource inputs used in the
degree of cost effectiveness (not cost effective, cost effective,
production of an intervention at a level above that of the patient
or very cost effective) in order to ascertain order of magnitude
or providing facility, such as central planning and administration
differences in cost effectiveness. In addition, we undertook a
functions, supervision, and training. Estimated quantities of
probabilistic uncertainty analysis using MCLeague software31
resources required for central planning and administration at
to assess the impact of alternative assumptions on costs and
national, provincial and district levels were based on a series of
effects (which were each varied with plus and minus 25% of
evaluations made by WHO-CHOICE costing experts in the
their baseline values) on the classification of interventions.
different sub-regions and validated against the literature
(categories of resource input included personnel, training,
materials and supplies, media, transport, maintenance, utilities
and capital.22 Details of all cost calculations are found in
A few modifications were made to previously published
appendix A on bmj.comand previously published papers.9-12 An
analyses.9-12 Firstly, interventions were considered during the
example of all variable inputs including its sources is provided
10 year period 2005to 2015 rather than the period 2000–10, and
in table 3for the cost effectiveness analysis of screening
costs were reported at price levels for year 2005 instead of 2000.
strategies for uncorrected refractive error among schoolchildren
Secondly, because of variations in the reporting of coverage
in sub-Saharan Africa.
levels in previous studies, interventions were evaluated at
standardised geographic coverage levels of 50%, 80%, and 95%.
Following the WHO-CHOICE standardised approach, we
Thirdly, assumptions on screening, patient, training, and
assumed that interventions were performed optimally (that is,
intervention programme costs were revisited to make results
no undertreatment or overtreatment at the highest efficiency
consistent across the analysis. For example, recent price
level).14 All costs were reported in international dollars ($Int)
reductions of azithromycin after patent expiry were included in
for the year 2005 to facilitate more meaningful comparisons
the analysis on trachoma control.
across regions ($Int1 buys the same quantity of healthcare
resources in the sub-Saharan African and South East Asian
regions as it does in the United States). For example, cost
estimates in sub-Saharan Africa in $Int should be divided by a
Following the stepwise approach to the rank ordering of
factor 2.3 to obtain US$ cost estimates for Kenya (in South East
interventions on the basis of their cost effectiveness, we first
Asia cost estimates should be divided by a factor 3.1 to obtain
report the average cost effectiveness ratios of all interventions
US$ cost estimates for India).15 All costs and effects are
within each disease area (appendix table B1 on bmj.com).
discounted at 3%, following standardised WHO-CHOICE
Second, we report the incremental cost effectiveness ratios for
those interventions that both cost less and provide more health
Estimating cost effectiveness
effects than other interventions, and these indicate the economic
attractiveness of interventions within each disease area (same
We rank ordered interventions on the basis of their cost
effectiveness in a number of standardised steps.14 Firstly, within
In trachoma control, trichiasis surgery is the most cost effective
each disease area, we calculated the average cost effectiveness
intervention, followed by mass treatment with azithromycin in
ratios for every intervention by dividing its total number of
both regions. Both mass treatment with tetracycline ointment
DALYs averted by its total costs. Secondly, again within each
and targeted treatment with azithromycin are not cost effective.
disease area, we considered only those interventions that were
In cataract control, extracapsular cataract surgery dominates
No commercial reuse: See rights and reprints
BMJ 2012;344:e615 doi: 10.1136/bmj.e615 (Published 2 March 2012)
intracapsular surgery in both regions. In both regions, passive
cost effective. Mass treatment with azithromycin to control
screening of children and adults for hearing disorders (in
trachoma can be considered cost effective in the sub-Saharan
combination with provision of hearing aids) is most cost
African but not the South East Asian region.
effective, followed by screening of adults every five years and
annual screening of primary and secondary school children.
Strengths and limitations
Screening of adults every 10 years is not cost effective. For
treatment of chronic otitis media, treatment with topical
The analysis has several limitations. Firstly, we performed our
antibiotics is the most cost effective intervention in both regions.
analysis at the regional level, but important differences in costs
For screening for refractive error (including the provision of
or effectiveness of interventions may exist between countries
spectacles), screening of all primary and secondary school
in the same region. Since decision making is made at the country
children is most cost effective in sub-Saharan Africa. In South
(as opposed to regional) level, more refined estimates of costs,
East Asia, screening of secondary school children is most cost
effects, and cost effectiveness should be made at the country
effective, followed by screening of both primary and secondary
level, based on country-specific data. A good example is the
school children.
contextualisation of WHO-CHOICE regional results to the
country level in Mexico, as reported in this series.32
In a third step, we rank interventions according to their
incremental cost effectiveness ratio across all disease areas
Secondly, assumptions on intervention effectiveness are based
(tables and for sub-Saharan Africa and South East Asia).
on a variety of sources and may reflect contexts other than the
This is illustrated in the figurefor sub-Saharan Africa.
regions analysed—the same level of effectiveness may not
Implementation of all cost effective interventions would cost
always be realised in reality, and results should be interpreted
around $Int19 per capita in sub-Saharan Africa.
with caution. Yet, our probabilistic uncertainty analysis indicates
that our study results are robust to alternative assumptions.
In both regions treatment of chronic otitis media with topical
These issues are discussed in detail in previously published
antibiotics is the most cost effective intervention, with an
average cost per DALY averted of <$Int63 at all levels. In
sub-Saharan Africa the next most cost effective interventions
Thirdly, we did not evaluate all possible interventions that could
are trichiasis surgery, extracapsular cataract surgery, annual
reduce vision or hearing loss, and our choice of interventions
screening of all primary and secondary school children for
is somewhat arbitrary. Policymakers should be aware of this,
refractive error, and treatment for meningitis with ceftriaxione.
and should not limit their choice of interventions to those
In South East Asia the next most cost effective interventions
included in this analysis.
are treatment of meningitis with ceftriaxione, extracapsular
Fourthly, and more specifically, we evaluated screening for
cataract surgery, screening of all primary and secondary school
hearing disorders as carried out by trained primary health
children for refractive error, and trichiasis surgery. In both
workers (incurring healthcare costs), and screening for refractive
regions these interventions all cost <$Int285 per DALY averted
error as carried out by trained school teachers (who incur no
(incremental cost effectiveness ratio, with the exact order of
healthcare costs). However, alternative assumptions have only
interventions dependent on coverage level). In both regions
limited impact on study results.
introducing screening for hearing impairment in combination
Fifthly, in the absence of reliable data, we did not include time
with the delivery of hearing aids, at 80% coverage level costs
costs of people seeking and undergoing care, nor did we include
around $Int1000 per DALY averted. According to
changes in productivity losses as a result of the interventions.
WHO-CHOICE benchmark on cost effectiveness, these
The perspective of analysis is therefore not truly societal.
interventions can all be considered very cost effective. Mass
Inclusion of productivity gains after reductions in vision and
treatment with azithromycin is the least cost effective
hearing loss would render the interventions more cost effective.
intervention in both regions but can, depending on the coverage
Sixthly, we assumed that all interventions were implemented
level, still be considered cost effective in the sub-Saharan
at a relatively high efficiency level—which allows an equal
African region. In the absence of any budgetary constraint
comparison between the cost effectiveness of interventions and
implementation of all interventions would lead to a total health
avoids the complications from interventions that were not
gain of up to 32 million DALYs in sub-Saharan Africa and 84
implemented well would be disadvantaged in comparison with
million DALYs in South East Asia.
those that were well implemented.
The probabilistic uncertainty analysis depicted in appendix C
Lastly, the analysis evaluates interventions at 50%, 80%, and
on bmj.com shows the impact of plausible variations in total
95% geographic coverage levels, following standardised
costs and total effects and shows that the average cost
WHO-CHOICE methodology. The higher coverage levels may
effectiveness ratios of most interventions would retain their
not always be achievable but are included to indicate the
classification of highly cost effective or cost effective after
economies of scale that may take place when more people are
taking into account such uncertainty. A similar logic would
reached with an intervention.23
apply to the incremental cost effectiveness ratio.
The above limitations should be considered in the overall aim
of WHO-CHOICE analysis to provide broad indications on the
cost effectiveness of a range of interventions to inform general
policy discussions, rather than to deliver precise estimates on
a specific intervention.15
Treatment of chronic otitis media, extracapsular cataract surgery,
trichiasis surgery, treatment for meningitis, and annual screening
Study strengths include the use of disease models that have
of school children for refractive error are among the most cost
already been published and applied, consideration of
effective interventions available to control hearing and vision
combinations of interventions, use of a generic measure of
impairment, with the cost per DALY averted <$Int285 in both
effectiveness, and testing of important assumptions through
regions. Screening of both schoolchildren (annually) and adults
(every five years) for hearing loss costs around $Int1000 per
DALY averted. These interventions can be considered highly
No commercial reuse: See rights and reprints
BMJ 2012;344:e615 doi: 10.1136/bmj.e615 (Published 2 March 2012)
Comparison with other studies
World Health Organization. Fact sheet—magnitude and causes of visual impairment .
This study includes a number of modifications in comparison
Mathers C, Smith A, Concha M. Global burden of hearing loss in the year 2000 . WHO,
to the previously published analysis. The higher 2005 price
Mathers C, Smith A, Concha M. Global burden of adult-onset hearing loss in the year
levels have generally resulted in higher cost effectiveness ratios,
2002 . WHO, 2005.
but these and other modifications have generally not changed
Smith A, Mathers C. Epidemiology of infection as a cause of hearing loss. In: Newton VE,
Vallely PJ, eds. Infection and hearing impairment . John Wiley, 2006.
study conclusions. The exception is mass or targeted treatment
Mackenzie I, Smith A. Deafness—the neglected and hidden disability. Ann Trop Med
with azithromycin in trachoma control, where price reductions
of azithromycin have offset general price increases in the period
World Health Organization. Fact sheet—deafness and hearing impairment . WHO, 2011.
from 2000 to 2005 and have thus rendered the interventions
Vision 2020. Global initiative for the elimination of avoidable blindness. 2011.
more cost effective.
World Health Organisation, World Wide Hearing 2009. Seventh workshop on provision
of hearing aids and services for developing countries and WWHearing General Assembly.
Report of workshop and general assembly. 12-13 November 2009. WHO, 2009.
Baltussen R, Sylla M, Mariotti SP. Cost-effectiveness analysis of cataract surgery: a global
Our results have four major policy implications. Firstly, they
and regional analysis. Bull World Health Organ 2004;82:338-45.
10 Baltussen RM, Sylla M, Frick KD, Mariotti SP. Cost-effectiveness of trachoma control in
reinforce the fact that cataract surgery and treatment of chronic
seven world regions. Ophthalmic Epidemiol 2005;12:91-101.
otitis media are among the key interventions for combating
11 Baltussen R, Naus J, Limburg H. Cost-effectiveness of screening and correcting refractive
errors in school children in Africa, Asia, America and Europe. Health Policy 2009;89:201-15.
vision and hearing impairment.
12 Baltussen R, Smith A. Cost-effectiveness of hearing impairment control in Africa and Asia:
Secondly, they show that there is a strong economic case to
a mathematical modelling approach. Int J Audiol 2009;48:144-58.
13 Hutubessy R, Chisholm D, Edejer TT. Generalized cost-effectiveness analysis for
consider screening for refractive error among schoolchildren.
national-level priority-setting in the health sector. Cost Eff Resour Alloc 2003;1:8
This supports current efforts within the VISION 2020 initiative
14 Tan Torres, T, Baltussen RM, Adam T, Hutubessy RC, Acharya A, Evans DB. WHO guide
to cost-effectiveness analysis . WHO, 2003.
to give greater prominence to screening programmes. Screening
15 Evans DB, Lim SS, Adam T, Tan-Torres Edejer T, the WHO-CHOICE MDG Team.
schoolchildren and adults for hearing disorders is somewhat
Achieving the Millennium Development Goals for health: a re-examination of intervention
strategies. BMJ 2005;331:1457-61.
less cost effective but is still economically attractive according
16 Resnikoff S, Pascolini D, Etya'ale D, Kocur I, Pararajasegaram R, Pokharel GP, et al.
to commonly used benchmarks.
Global data on visual impairment in the year 2002. Bull World Health Organ
Thirdly, inclusion of mass treatment with azithromycin in
17 Resnikoff S, Pascolini D, Mariotti SP, Pokharel GP. Global magnitude of visual impairment
programmes to eliminate trachoma needs careful analysis:
caused by uncorrected refractive errors in 2004. Bull World Health Organ 2008;86:63-70.
18 World Health Organisation. The global burden of disease: 2004 update . Available at:
although the intervention was cost effective in sub-Saharan
Africa according to commonly used benchmarks, it was not in
19 Lauer JA, Murray CJL, Roehrich K, Wirth H. PopMod: a longitudinal four-state population
model with two disease states and comorbidity. Cost Eff Resour Alloc 2003;1:6.
South East Asia. However, many programmes around the world
20 Murray CJL, Lopez A. Global burden of disease . World Bank, WHO, Harvard University,
use donated azithromycin, which makes the intervention
21 International drug price indicator guide. Introduction. 2011.
economically more attractive than we have reported here. In
our analysis, trichiasis surgery is more cost effective and thus
22 Johns B, Baltussen R, Adam T, Hutubessy RCW. Programme costs in the economic
provides better value for money.
evaluation of health interventions. Cost Eff Resour Alloc 2003;1:1.
23 Johns B, Baltussen R. Accounting for the costs of scaling up health interventions. Health
Fourth, our results show that substantial health gains can be
24 Adam T, Evans DB, Murray CJL. Econometric estimation of country-specific hospital
achieved—up to 32 and 84 million DALYs averted in
costs. Cost Eff Resour Alloc 2003;1:3.
sub-Saharan Africa and South East Asia respectively, when
25 Unicef. Database on school enrolment. 2008.
available effective interventions are scaled up. This will require
26 Murray CJL, Lopez AD. The global burden of disease: a comprehensive assessment of
major resource mobilisation efforts at domestic and international
mortality and disability from diseases, injuries, and risk factors in 1990 and projected to
level. Yet, whether such substantial investments are warranted
2020. Harvard University Press, 1996.
27 Limburg H, Kansara HT, d'Souza S. Results of school eye screening of 5.4 million children
can only be judged when the findings our present study—that
in India—a five-year follow-up study. Acta Ophthalmol Scand 1999;77:310-4.
vision and hearing impairment control interventions are
28 Hogeweg M, Sapkota YD, Foster A. Acceptability of aphakic correction. Results from
Karnali eye camps in Nepal. Acta Ophthalmologica 1992;70:407-12.
generally cost effective—are considered in relation to the
29 Limburg H, Vaidyanathan K, Dalal HP. Cost-effective screening of schoolchildren for
economic attractiveness of other, existing or new, interventions
refractive errors. World Health Forum 1995;16:173-8.
30 Hutubessy RC, Baltussen RM, Evans DB, Barendregt JJ, Murray CJ. Stochastic league
in health. For this broader analysis, we refer to Evans et al15 and
tables: communicating cost-effectiveness results to decision-makers. Health Econ
Chisholm et al,33 who compare the economic attractiveness of
a wide range of interventions to control, respectively,
31 Salomon J, Carvalho N, Gutierrez-Delgado C, Casey A, Hogan DR, Lee D, et al.
Intervention strategies to reduce burden of non-communicable diseases in Mexico: cost
communicable and non-communicable diseases.
effectiveness analysis. BMJ 2012;344:e355.
32 Chisholm D, Baltussen, Evans DB, Ginsberg G, Lauer J, Lim S, et al. What are the priorities
for prevention and control of non-communicable diseases and injuries in sub-Saharan
Contributors: Both authors contributed to the conception, design and
Africa and South East Asia? BMJ 2012;344:e586.
33 Congdon N, Zheng M, Sharma A, Choi K, Song Y, Zhang M, et al. Prevalence and
interpretation of data, and drafting of the manuscript. RB performed the
determinants of spectacle nonwear among rural Chinese secondary schoolchildren: the
technical analysis. Both authors approved the submitted version of the
Xichang Pediatric Refractive Error Study Report 3. Arch Ophthalmol 2008;126:1717-23.
manuscript. RB is the guarantor of the manuscript.
34 Vincent JE, Netek S, Parry A, Mladenovich D, Thein NN, Amendola PR. Reported wearing
compliance of ready-made spectacles at 6 and 12 months. Optom Vis Sci 2010;87:958-65.
Competing interests: All authors have completed the Unified Competing
Accepted: 12 October 2011
Interest form at (available on requestfrom the corresponding author) and declare: no support from any
Cite this as: BMJ 2012;344:e615
organisation for the submitted work; no financial relationships with any
This is an open-access article distributed under the terms of the Creative Commons
organisations that might have an interest in the submitted work in the
Attribution Non-commercial License, which permits use, distribution, and reproduction in
previous three years, no other relationships or activities that could appear
any medium, provided the original work is properly cited, the use is non commercial and
to have influenced the submitted work.
is otherwise in compliance with the license. See:
Ethical approval: Ethical approval was not required for this study.
Data sharing: No additional data available
No commercial reuse: See rights and reprints
BMJ 2012;344:e615 doi: 10.1136/bmj.e615 (Published 2 March 2012)
What is already known on this topic
Several studies have reported on the global and regional cost effectiveness of interventions targeting cataract, trachoma, refractive error
and different causes of hearing impairment.
However, studies have been carried out in isolation, which prevents the cost effectiveness of the different interventions in visual and
hearing impairment control being directly compared.
In addition, these studies have been analysed using year 2000 demographics and price levels
What this study adds
This study directly compares cost and effects of interventions targeting cataract, trachoma, refractive error and different causes of
hearing impairment, using more recent price levels in Sub-Saharan Africa and South East AsiaThis allows the identification of most efficient strategies to reduce vision and hearing loss
Table 1 Prevalence of vision and hearing loss in WHO sub-Saharan African sub-region AfrE, South East Asian sub-region SearD, and the
world (2004 estimates). Values are millions of people (percentages)
Total population*
Age related macular degeneration
Corneal opacities
Diabetic retinopathy
Childhood blindness
Uncorrected refractive error‡
Uncorrected refractive error
Moderate or greater hearing impairment*
Adult onset
*Based on 2004 burden of disease estimates.18†Based on Resnikoff et al.1617 Figures relate to year 2004 and do not match with figures on year 2010 as provided in main text (the latter figures are not yet availableby cause).
‡Estimates in absolute numbers are for ages ≥50 years. Percentages are compared with total population of all ages.
No commercial reuse: See rights and reprints
BMJ 2012;344:e615 doi: 10.1136/bmj.e615 (Published 2 March 2012)
Table 2 List of interventions considered in cost effectiveness analysis of strategies to combat vision and hearing loss in WHO sub-Saharan
African sub-region AfrE and South East Asian sub-region SearD
Mass treatment tetracycline ointment (50% coverage)
Mass treatment azithromycin (50% coverage)
Targeted treatment azithromycin (50% coverage)
Trichiasis surgery (50% coverage)
Mass treatment tetracycline ointment + trichiasis surgery (50% coverage)
Mass treatment azithromycin + trichiasis surgery (50% coverage)
Targeted treatment azithromycin + trichiasis surgery (50% coverage)
Mass treatment tetracycline ointment (80% coverage)
Mass treatment azithromycin (80% coverage)
Targeted treatment azithromycin (80% coverage)
Trichiasis surgery (80% coverage)
Mass treatment tetracycline ointment + trichiasis surgery (80% coverage)
Mass treatment azithromycin + trichiasis surgery (80% coverage)
Targeted treatment azithromycin + trichiasis surgery (80% coverage)
Mass treatment tetracycline ointment (95% coverage)
Mass treatment azithromycin (95% coverage)
Targeted treatment azithromycin (95% coverage)
Trichiasis surgery (95% coverage)
Mass treatment tetracycline ointment + trichiasis surgery (95% coverage)
Mass treatment azithromycin + trichiasis surgery (95% coverage)
Targeted treatment azithromycin + trichiasis surgery (95% coverage)
Extracapsular cataract extraction with posterior chamber lens implant (50% coverage)
Extracapsular cataract extraction with posterior chamber lens implant (80% coverage)
Extracapsular cataract extraction with posterior chamber lens implant (95% coverage)
Screening for hearing loss†
HEA-1
Annual screening primary school children (50% coverage)
Annual screening secondary school children (50% coverage)
Annual screening primary and secondary school children (50% coverage)
Screening adults every 5 years (50% coverage)
Screening adults every 10 years (50% coverage)
Passive screening all children and adults (50% coverage)
Annual screening primary school children + screening adults every 5 years (50% coverage)
Annual screening primary school children + screening adults every 10 years (50% coverage)
Annual screening secondary school children + screening adults every 5 years (50% coverage)
Annual screening secondary school children + screening adults every 10 years (50% coverage)
Annual screening primary and secondary school children + screening adults every 5 years (50% coverage)
Annual screening primary and secondary school children + screening adults every 10 years (50% coverage)
Annual screening primary school children (80% coverage)
Annual screening secondary school children (80% coverage)
Annual screening primary and secondary school children (80% coverage)
Screening adults every 5 years (80% coverage)
Screening adults every 10 years (80% coverage)
Passive screening all children and adults (80% coverage)
Annual screening primary school children + screening adults every 5 years (80% coverage)
Annual screening primary school children + screening adults every 10 years (80% coverage)
Annual screening secondary school children + screening adults every 5 years (80% coverage)
No commercial reuse: See rights and reprints
BMJ 2012;344:e615 doi: 10.1136/bmj.e615 (Published 2 March 2012)
Table 2 (continued)
Annual screening secondary school children + screening adults every 10 years (80% coverage)
Annual screening primary and secondary school children + screening adults every 5 years (80% coverage)
Annual screening primary and secondary school children + screening adults every 10 years (80% coverage)
Annual screening primary school children (95% coverage)
Annual screening secondary school children (95% coverage)
Annual screening primary and secondary school children (95% coverage)
Screening adults every 5 years (95% coverage)
Screening adults every 10 years (95% coverage)
Passive screening all children and adults (95% coverage)
Annual screening primary school children + screening adults every 5 years (95% coverage)
Annual screening primary school children + screening adults every 10 years (95% coverage)
Annual screening secondary school children + screening adults every 5 years (95% coverage)
Annual screening secondary school children + screening adults every 10 years (95% coverage)
Annual screening primary and secondary school children + screening adults every 5 years (95% coverage)
Annual screening primary and secondary school children + screening adults every 10 years (95% coverage)
Ceftriaxione (50% coverage)
Ceftriaxione (80% coverage)
Ceftriaxione (95% coverage)
Chronic otitis media control
COM-1
Aural toilet (50% coverage)
Topical antibiotics (50% coverage)
Aural toilet (80% coverage)
Topical antibiotics (80% coverage)
Aural toilet (95% coverage)
Topical antibiotics (95% coverage)
Annual screening all primary school children (50% coverage)
Annual screening all secondary school children (50% coverage)
Annual screening all primary and secondary school children (50% coverage)
Annual screening children 8 years old (50% coverage)
Annual screening children 13 years old (50% coverage)
Annual screening children 8 and 13 years old (50% coverage)
Annual screening all primary school children (80% coverage)
Annual screening all secondary school children (80% coverage)
Annual screening all primary and secondary school children (80% coverage)
Annual screening children 8 years old (80% coverage)
Annual screening children 13 years old (80% coverage)
Annual screening children 8 and 13 years old (80% coverage)
Annual screening all primary school children (95% coverage)
Annual screening all secondary school children (95% coverage)
Annual screening all primary and secondary school children (95% coverage)
Annual screening children 8 years old (95% coverage)
Annual screening children 13 years old (95% coverage)
Annual screening children 8 and 13 years old (95% coverage)
*Coverage level relates to the geographic coverage of these eligible for intervention.
†Screening for hearing loss is in combination with the provision of hearing aids to those who need it.
‡Screening for uncorrected refractive error is in combination with the provision of spectacles to those who need it.
No commercial reuse: See rights and reprints
BMJ 2012;344:e615 doi: 10.1136/bmj.e615 (Published 2 March 2012)
Table 3 Model inputs for cost effectiveness analysis of screening strategies for uncorrected refractive error in schoolchildren in WHO
sub-Saharan African sub-region AfrE
Data source
Target population
Primary school enrolment rate
Secondary school enrolment rate
Health effects
Health state valuation of visual impairment
Burden of disease study26
Remission rate of uncorrected refractive error (without screening or
treatment)Remission rate of uncorrected refractive error (intervention scenarios)
Compliance with wearing provided glassess
Assumption based on Limburg et al27 in India;
Hogeweg et al28 in Nepal‡
No of children to screen per teacher (5–10 years old)
Limburg et al29 in India¶
No of children to screen per teacher (8 years old)
No of children to screen per teacher (11–15 years old)
No of children to screen per teacher (13 years old)
Duration of training (days)
Repetition of training (every number of years)
Cost per teacher to train (cost per day)
Ratio of true positive:false positive cases
Limburg et al29 in India¶
Useful life of glasses (years)
Screening material costs (tape, card etc)
Treatment at health clinic:
Cost of ophthalmic assistant:
Time spent per patient (minutes)
Costs of ophthalmic equipment:
Useful life (years)
Average annual patient load
Costs of spectacles:
Useful life (years)
Costs of outpatient visits:
Limburg et al29 in India¶
Costs of visits at secondary hospital level
*Based on personal communication with Dr Mariotti (WHO) and Dr Limburg (independent consultant), both specialists in ophthalmology in low and middle incomesettings.
†Formula is −LN(1−(effectiveness×coverage)), with effectiveness equal to compliance and coverage as defined in intervention. The table lists the remission ratefor a coverage of 95%.
‡Estimates based on two studies in the respective regions, and are in line with findings from other studies in China34 and Thailand.35§The number of teachers to train depends on the number of schoolchildren that one teacher can screen and, ultimately, on school size. In screening of childrenaged 5–10 years, a trained teacher can serve all classes in the school, on average 165 children. In case only children of aged 8 years are screened, the teachercan screen only that class, on average 50 children. The same logic applies to screening at secondary school.
¶To our knowledge, this is the only study that provides the required details on costs of screening for refractive error in a low income setting and has therefore beenused as the basis for our estimates.
No commercial reuse: See rights and reprints
BMJ 2012;344:e615 doi: 10.1136/bmj.e615 (Published 2 March 2012)
Table 4 Cost effectiveness of strategies to combat vision and hearing loss in WHO sub-Saharan African sub-region AfrE
Annual DALYs
Cost effectiveness ratio
Annual cost per
saved per million
Disease area and intervention
Coverage (%)
COM-2: Chronic otitis media, topical antibiotics
COM-4: Chronic otitis media, topical antibiotics
COM-6: Chronic otitis media, topical antibiotics
TRA-11: Trachoma, trichiasis surgery
CAT-4: Cataract, extracapsular cataract extraction
with posterior chamber lens implantCAT-6: Cataract, extracapsular cataract extraction
with posterior chamber lens implantTRA-18: Trachoma, trichiasis surgery
RE-9: Uncorrected refraction error, annual
screening of all schoolchildren‡MEN-1: Meningitis, ceftriaxione
RE-15: Uncorrected refraction error, annual
screening of all schoolchildren‡HEA-6: Hearing loss, passive screening of all
children and adults§HEA-18: Hearing loss, passive screening of all
children and adults§HEA-4: Hearing loss, screening of adults every 5
years§HEA-16: Hearing loss, screening of adults every
5 years§MEN-2: Meningitis, ceftriaxione
HEA-23: Hearing loss, annual screening of
schoolchildren + screening of adults every 5
years§TRA-20: Trachoma, mass treatment with
azithromycin + trichiasis surgeryMEN-3: Meningitis, ceftriaxione
HEA-35: Hearing loss, annual screening of school
children + screening of adults every 5 years§
DALYs=disability adjusted life years. $Int=international dollars.
*$Int per DALY averted relative to no intervention.
†$Int per DALY averted, within intervention cluster. This measures the increase in cost divided by the increase in effects when a new intervention is added to anexisting intervention. For example, the incremental cost per DALY averted for screening primary and secondary school children for refractive error is the totalincrease in cost divided by the total increase in DALYs averted when screening of primary school children is added to the existing screening of secondary schoolchildren. Incremental ratios are only shown for interventions that are both more effective and less costly than other interventions.
‡Screening for uncorrected refractive error is in combination with the provision of spectacles to those who need it.
§Screening for hearing loss is in combination with the provision of hearing aids to those who need it.
No commercial reuse: See rights and reprints
BMJ 2012;344:e615 doi: 10.1136/bmj.e615 (Published 2 March 2012)
Table 5 Cost effectiveness of strategies to combat vision and hearing loss in WHO South East Asian sub-region SearD
Annual DALYs
Cost effectiveness ratio
Annual cost per
saved per million
Disease area and intervention
Coverage (%)
COM-2: Chronic otitis media, topical antibiotics
COM-4: Chronic otitis media, topical antibiotics
COM-6: Chronic otitis media, topical antibiotics
MEN-1: Meningitis, ceftriaxione
CAT-6: Cataract, extracapsular cataract extraction
with posterior chamber lens implantMEN-2: Meningitis, ceftriaxione
RE-2: Uncorrected refraction error, annual
screening of all secondary school children‡RE-8: Uncorrected refraction error, annual
screening of all secondary school children‡RE-9: Uncorrected refraction error, annual
screening of all schoolchildren‡MEN-3: Meningitis, ceftriaxione
TRA-11: Trachoma, trichiasis surgery
RE-15: Uncorrected refraction error, annual
screening of all schoolchildren‡HEA-6: Hearing loss, passive screening of all
children and adults§TRA-18: Trachoma, trichiasis surgery
HEA-18: Hearing loss, passive screening of all
children and adultsHEA-11: Hearing loss, annual screening of
schoolchildren + screening of adults every 5 years§HEA-23: Hearing loss, annual screening of
schoolchildren + screening of adults every 5 years§HEA-35: Hearing loss, annual screening of school
children + screening of adults every 5 years§TRA-20: Trachoma, mass treatment with
azithromycin + trichiasis surgery
DALYs=disability adjusted life years. $Int=international dollars.
*$Int per DALY averted relative to no intervention.
†$Int per DALY averted, within intervention cluster. This measures the increase in cost divided by the increase in effects when a new intervention is added to anexisting intervention. For example, the incremental cost per DALY averted for screening primary and secondary school children for refractive error is the totalincrease in cost divided by the total increase in DALYs averted when screening of primary school children is added to the existing screening of secondary schoolchildren. Incremental ratios are only shown for interventions that are both more effective and less costly than other interventions.
‡Screening for hearing loss is in combination with the provision of spectacles to those who need it.
§Screening for uncorrected refractive error is in combination with the provision of hearing aids to those who need it.
No commercial reuse: See rights and reprints
BMJ 2012;344:e615 doi: 10.1136/bmj.e615 (Published 2 March 2012)
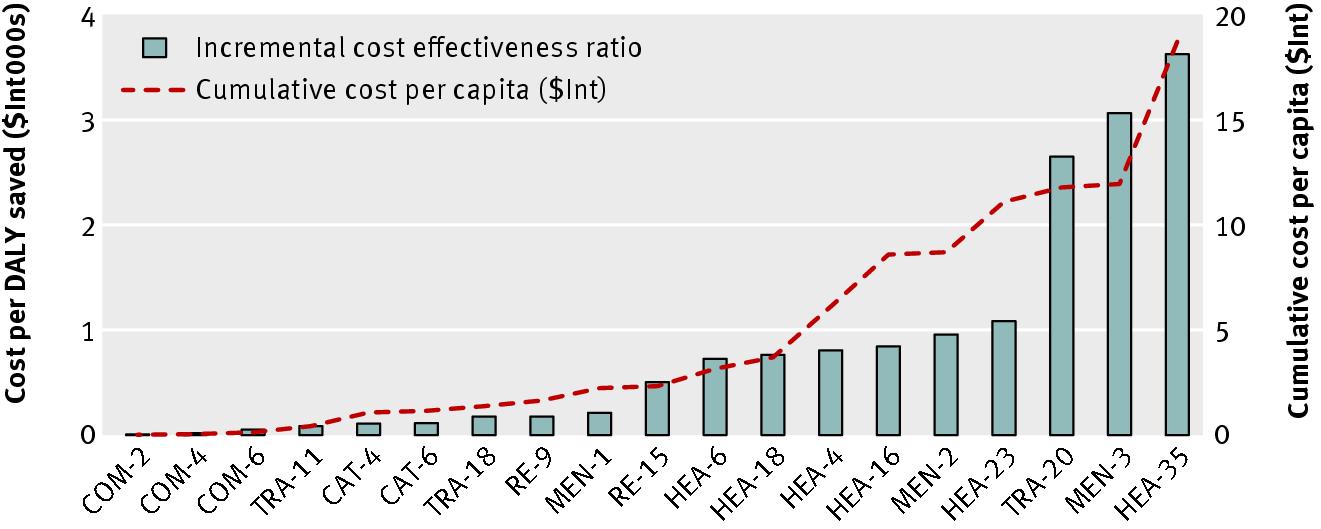
Incremental cost effectiveness ratios and cumulative cost per capita ($Int) of interventions to combat vision and hearing
loss in WHO sub-Saharan African sub-region AfrE. Cost per DALY averted (bars) ranges from very cost effective (such as
treatment of chronic otitis media with topical antibiotics at 50% coverage (COM-2) costing $Int16 per DALY averted) to
least cost effective (annual screening of schoolchildren and screening of adults every five years for hearing loss (HEA-35)
costing $Int3639 per DALY averted). Cumulative cost per capita (dashed line) shows cost if interventions are implemented
in order of decreasing economic attractiveness. In case only COM-2 is implemented, cost per capita is $Int0.01. If all shown
interventions are implemented, costs per capita increase to $Int14.86. See table 4for descriptions of the intervention
No commercial reuse: See rights and reprints
Source: http://www.niche1.nl/resources/content/publication_file_75_bmj.e615.full.pdf
Sexual Function and Quality of Life in Women with UrinaryIncontinence Treated by a Complete Pelvic Floor RehabilitationProgram (Biofeedback, Functional Electrical Stimulation, PelvicFloor Muscles Exercises, and Vaginal Cones)jsm_16761.9 Massimo Rivalta, MD, Maria Chiara Sighinolfi, MD, Salvatore Micali, MD, Stefano De Stefani, MD, andGiampaolo Bianchi, MD
und zählen streng genommen zu den „Neuen": Viagabatrin (Sab- Stellungnahme aus dem Jahr 2005 (veröffentlicht auf der Web- kontrolle – sollten grundsätzlich ergänzend zur medikamentösen ril®), Rufinamid (Inovelon®) und Diacomid (Stiripentol®). site der DGfE: www.dgfe.org) bei einer erfolgreichen Behandlung Therapie eingesetzt werden; andere - z.B. Epilepsiechirurgie,