Downloadketab.net


Archives of Biochemistry and Biophysics 539 (2013) 9–19
Contents lists available at ScienceDirect
Archives of Biochemistry and Biophysics
Acetylsalicylic acid (aspirin) and salicylic acid interaction with thehuman erythrocyte membrane bilayer induce in vitro changes inthe morphology of erythrocytes
Mario Suwalsky a,⇑, Jessica Belmar a, Fernando Villena b, María José Gallardo c,Malgorzata Jemiola-Rzeminska d, Kazimierz Strzalka d
a Faculty of Chemical Sciences, University of Concepción, Concepción, Chileb Faculty of Biological Sciences, University of Concepción, Concepción, Chilec Center for Optics and Photonics, University of Concepción, Concepción, Chiled Department of Plant Physiology and Biochemistry, Faculty of Biochemistry, Biophysics and Biotechnology, Jagiellonian University, Krakow, Poland
Despite the well-documented information, there are insufficient reports concerning the effects of salicy-
Received 7 August 2013
late compounds on the structure and functions of cell membranes, particularly those of human erythro-
and in revised form 6 September 2013
cytes. With the aim to better understand the molecular mechanisms of the interaction of acetylsalicylic
Available online 18 September 2013
acid (ASA) and salicylic acid (SA) with cell membranes, human erythrocyte membranes and molecularmodels were utilized. These consisted of bilayers of dimyristoylphosphatidylcholine (DMPC) and dimyr-
istoylphosphatidylethanolamine (DMPE), representative of phospholipid classes located in the outer and
Acetylsalicylic acid
inner monolayers of the human erythrocyte membrane, respectively. The capacity of ASA and SA to per-
turb the multibilayer structures of DMPC and DMPE was evaluated by X-ray diffraction while DMPC uni-
Salicylic acidErythrocyte membrane
lamellar vesicles (LUV) were studied by fluorescence spectroscopy. Moreover, we took advantage of the
Phospholipid bilayer
capability of differential scanning calorimetry (DSC) to detect the changes in the thermotropic phasebehavior of lipid bilayers resulting from ASA and SA interaction with PC and PE molecules. In an attemptto further elucidate their effects on cell membranes, the present work also examined their influence onthe morphology of intact human erythrocytes by means of defocusing and scanning electron microscopy,while isolated unsealed human erythrocyte membranes (IUM) were studied by fluorescence spectros-copy. Results indicated that both salicylates interact with human erythrocytes and their molecular mod-els in a concentration-dependent manner perturbing their bilayer structures.
Ó 2013 Elsevier Inc. All rights reserved.
boxane synthesis [2]. Although a major clinical use of aspirin (ASA)therapy is to improve the survival of patients with myocardial infarc-
Acetylsalicylic acid (ASA)1 is one of the most widely used medica-
tion and unstable angina, which is usually attributed to the antiplate-
tions, amply used as an analgesic to relieve minor aches and pains, as
let action of aspirin, involvement of salicylates in other mechanisms
an antipyretic to reduce fever, and as an anti-inflammatory medica-
of action cannot be excluded. Accordingly, aspirin has recently been
tion. These medicinal properties, particularly fever relief, have been
shown to protect endothelial cells against oxidative stresses, possibly
known since ancient times [1]. It also has an antiplatelet effect by
by promoting the synthesis of ferritin [3]. The main effects of orally
inhibiting the production of thromboxane. Much of this is believed
ingested ASA, especially in higher doses, are gastrointestinal ulcers,
to be on account of decreased production of prostaglandins and
stomach bleeding, and tinnitus [4]. On the other hand, salicylic acid
thromboxanes, which is due to its irreversible inactivation of the
(SA) is known for its ability to ease aches and pains and reduce fevers.
cyclooxygenase (COX) enzyme required for prostaglandin and throm-
However, it is so irritating to mucosa that it can only be used exter-nally [4]. Although toxic in large quantities, SA is used as a food pre-servative, bactericide and antiseptic. Increasing numbers of reports
⇑ Corresponding author.
assert that salicylate side effects including gastric intestinal toxicity
E-mail address: [email protected] (M. Suwalsky).
1 Abbreviations used: ASA, acetylsalicylic acid; SA, salicylic acid; DMPC, dim-
are actually due to nonspecific interactions with biomembranes [5].
yristoylphosphatidylcholine; DMPE, dimyristoylphosphatidylcholine; DSC, differen-
Despite the extensive and well documented information about
tial scanning calorimetry; SEM, scanning electron microscopy; LUV, large unilamellar
both salicylates, the reports on their effects on cell membranes, par-
vesicles; MLV, multilamellar vesicles; r, fluorescence anisotropy; GP, generalized
ticularly on those of the human erythrocyte are amazingly scanty.
polarization; DPH, 1,6-diphenyl-1,3,5-hexatriene; laurdan, 6-dodecanoyl-2-dim-
Cell membrane is a diffusion barrier which protects the interior of
ethylaminonaphtalene; DM, defocusing microscopy; RBC, red blood cell suspension.
0003-9861/$ - see front matter Ó 2013 Elsevier Inc. All rights reserved.
http://dx.doi.org/10.1016/j.abb.2013.09.006
M. Suwalsky et al. / Archives of Biochemistry and Biophysics 539 (2013) 9–19
the cell. Therefore, its structure and functions are susceptible to
gaseous nitrogen until a thin film on the wall of the glass test tube
alterations as a consequence of interactions with chemical species.
was formed. To remove the remnants of moisture, the samples
With the aim to better understand the molecular mechanisms of
were subsequently exposed to vacuum for 1 h and then dry lipid
the interaction of ASA and SA with cell membranes, human eryth-
films were suspended in buffer (1 mM EDTA/10 mM Hepes/
rocyte membranes and molecular models of red cell membranes
50 mM KCl, pH 7.0). ASA or SA was added in the concentration
were utilized. Human erythrocytes were chosen since with one
range of 0.02–5.0 mM. The multilamellar liposomes (MLV) were
membrane only and no internal organelles they constitute an ideal
prepared by vortexing the samples at the temperature above gel-
cell system for studying basic drug–biomembrane interactions [6].
to-liquid crystalline phase transition of the pure lipid (about
On the other hand, although less specialized than many other cell
30 °C for DMPC and 60 °C for DMPE). DSC experiments were per-
membranes, they carry out enough functions in common with them
formed using a NANO DSC Series III System with Platinum Capil-
such as active and passive transport, and the production of ionic
lary Cell (TA Instruments). The calorimeter was equipped with
and electric gradients, to be considered representative of the plas-
the original data acquisition and analysis software. In order to
ma membrane in general. The molecular models of cell membranes
avoid bubble formation during heating mode the samples were de-
consisted of dimyristoylphosphatidylcholine (DMPC) and dimyri-
gassed prior to being loaded by pulling a vacuum of 0.3–0.5 atm on
stoylphosphatidylethanolamine (DMPE) bilayers, representative
the solution for a period of 10–15 min. Then the sample cell was
of phospholipid classes located in the outer and inner monolayers
filled with about 400 ll of MLV suspension and an equal volume
of cell membranes, particularly of the human erythrocyte, respec-
of buffer was used as a reference. The cells were sealed and ther-
tively [7,8]. The capacity of ASA and SA to perturb the bilayer struc-
mally equilibrated for about 10 min below starting temperature
tures of DMPC and DMPE was evaluated by X-ray diffraction and
of the run. All measurements were made on samples under 3-bar
differential scanning calorimetry (DSC), DMPC large unilamellar
pressure. Data were collected in the range of 5–40 °C (DMPC)
vesicles (LUV) and isolated unsealed human erythrocyte mem-
and 30–70 °C (DMPE) at the scan rate 1 °C min�1 both for heating
branes (IUM) were studied by fluorescence spectroscopy, and intact
and cooling. Scans of buffer as a sample and a reference were also
human erythrocytes were observed by scanning electron (SEM) and
performed to collect the apparatus baseline. For the check of the
defocusing (DM) microscopy. These systems and techniques have
reproducibility each sample was prepared and recorded at least
been used in our laboratories to determine the interaction with
three times. Each data set was analysed for thermodynamic
and the membrane-perturbing effects of other drugs, particularly
parameters with the software package supplied by TA Instruments.
of anti-inflammatories such as diclofenac [9], naproxen [10,11],ibuprofen [12], and mefenamic acid [13].
Fluorescence measurements of large unilamellar vesicles (LUV) and ofisolated unsealed human erythrocyte membranes (IUM)
Materials and methods
The influence of ASA and SA on the physical properties of DMPC
X-ray diffraction studies of DMPC and DMPE multilayers
LUV and IUM was examined by fluorescence spectroscopy usingDPH and laurdan (Molecular Probe, Eugene, OR, USA) fluorescent
The capacity of ASA and SA to perturb the structures of DMPC
probes. DPH is widely used as a probe for the hydrophobic regions
and DMPE multilayers was evaluated by X-ray diffraction. Synthetic
of the phospholipid bilayers because of its favorable spectral proper-
DMPC (lot 140PC-246, MW 677.9) and DMPE (lot 140PE-60, MW
ties. Their steady-state fluorescence anisotropy measurements were
635.9) from Avanti Polar Lipids (AL, USA), acetylsalicylic acid and
used to investigate the structural properties of DMPC LUV and IUM
salicylic acid (99.5%, BP, Ph. Eur, USP) from Merck, Germany were
as it provides a measure of the rotational diffusion of the fluorophor,
used without further purification. 2 mg of each phospholipid were
restricted within a certain region such as a cone due to the lipid acyl
introduced into Eppendorf tubes which were then filled with
chain packing order. Laurdan, an amphiphilic probe, has high excita-
150 ll of (a) ASA aqueous solutions in a range of concentrations
tion sensitivity and emission spectra to the physical state of mem-
(0.02–0.5 mM) for DMPC experiments, (b) 0.1–5 mM for DMPE
branes. With the fluorescent moiety within a shallow position in
experiments, (c) 0.1–1.0 mM SA for DMPC experiments, and (d)
the bilayer, laurdan provides information about the polarity and/
0.5–10 mM SA for DMPE experiments. The specimens were shaken,
or molecular dynamics at the level of the phospholipid glycerol
incubated for 30 min at 30 °C and 60 °C with DMPC and DMPE,
backbone. The quantification of the laurdan fluorescence spectral
respectively and centrifuged for 10 min at 2500 rpm. Samples were
shift was effected by means of the general polarization (GP) concept
then transferred to 1.8 mm diameter special glass capillaries (Glas-
[14]. DMPC LUV suspended in water were prepared by extrusion of
Technik & Konstruktion, Berlin, Germany) and X-ray diffracted uti-
frozen and thawed multilamellar liposome suspensions (final lipid
lizing Ni-filtered CuKa radiation from a Bruker Kristalloflex 760
concentration 0.4 mM) through two stacked polycarbonate filters
(Karlsruhe, Germany) X-ray system. Specimen-to-detector dis-
of 400 nm pore size (Nucleopore, Corning Costar Corp., MA, USA) un-
tances were 8 and 14 cm, standardized by sprinkling calcite powder
der nitrogen pressure at 10 °C above the lipid phase transition tem-
on the capillary surface. The relative reflection intensities were ob-
perature. Erythrocytes were separated from heparinized venous
tained in an MBraun PSD-50 M linear position-sensitive detector
blood samples obtained from normal casual donors by centrifuga-
system (Garching, Germany); no correction factors were applied.
tion and washing procedures. IUM were prepared by lysis, according
The experiments were performed at 18 °C ± 1 °C, which is below
to Dodge et al. [15]. DPH and laurdan were incorporated into LUV
the main phase transition temperature of both DMPC (23.3 °C)
and IUM by addition of 2 ll/ml aliquots of 0.5 mM solutions of the
and DMPE (50.0 °C). Higher temperatures would have induced tran-
probe in dimethylformamide and ethanol, respectively, in order to
sitions onto more fluid phases making the detection of structural
obtain final analytical concentrations of 1 � 10�3 mM, and incu-
changes harder. Each experiment was performed in triplicate and
bated them at 37 °C for 45 min. Fluorescence spectra and anisotropy
in case of doubts, additional experiments were carried out.
measurements were performed in a phase shift and modulation K2steady-state and time resolved spectrofluorometer (ISS, Inc., Cham-
Differential scanning calorimetry (DSC) studies of phospholipid model
paign, IL, USA) interfaced to computer. Software from ISS was used
for both data collection and analysis. LUV suspensions measure-ments were carried out at 18 °C and 37 °C, and IUM measurements
Appropriate amounts of lipids (DMPC or DMPE) dissolved in
were made at 37 °C using 10 mm path-length square quartz cuv-
chloroform were gently evaporated to dryness under a stream of
ettes. Sample temperature was controlled by an external bath circu-
M. Suwalsky et al. / Archives of Biochemistry and Biophysics 539 (2013) 9–19
lator (Cole-Parmer, Chicago, IL, USA) and monitored before and aftereach measurement using an Omega digital thermometer (OmegaEngineering Inc., Stanford, CT, USA). Anisotropy measurements weremade in the L configuration using Glan Thompson prism polarizers(I.S.S., Inc.) in both exciting and emitting beams. The emission wasmeasured by means of a WG-420 Schott high-pass filter (SchottWG-420, Mainz, Germany) with negligible fluorescence. DPH fluo-rescence anisotropy (r) was calculated according to the definition:r = (Ik � I )/(Ik + 2I ), where Ik and I are the corresponding paralleland perpendicular emission fluorescence intensities with respect tothe vertically polarized excitation light [16]. Laurdan fluorescencespectral shifts were quantitatively evaluated using the GP concept(see above) which is defined by the expression GP = (Ib � Ir)/(Ib + Ir),where Ib and Ir are the emission intensities at the blue and red edgesof the emission spectrum, respectively. These intensities have beenmeasured at the emission wavelengths of 440 and 490 nm, whichcorrespond to the emission maxima of laurdan in both gel and liquidcrystalline phases, respectively [17]. ASA and SA were incorporatedinto LUV and IUM suspensions by addition of adequate (10 mM) ali-quots of concentrated solutions in order to obtain the different con-centrations used in this work. Samples thus prepared were thenincubated at 37 °C, for ca. 15 min and measured at 18 and 37 °C; at18 °C because the X-ray experiments were performed at about thistemperature, and at 37 °C because that is the normal temperatureat which erythrocytes circulate in humans. Blank subtraction wasperformed in all measurements using unlabeled samples withoutprobes. Data presented in Figs. 3–5 represent mean values and stan-dard error of ten measurements in two independent samples. Un-paired Student's t-test was used for statistical calculations.
Scanning electron microscopy (SEM) studies of human erythrocytes
Blood was obtained from healthy human male donor not receiv-
ing any pharmacological treatment. Blood samples (0.1 ml) wereobtained by puncture of the ear lobule and received in an Eppen-dorff tube containing 10 ll of heparin (5000 UI/ml) in 0.9 ml of sal-ine solution (NaCl 0.9%, pH 7.4). The sample was centrifuged
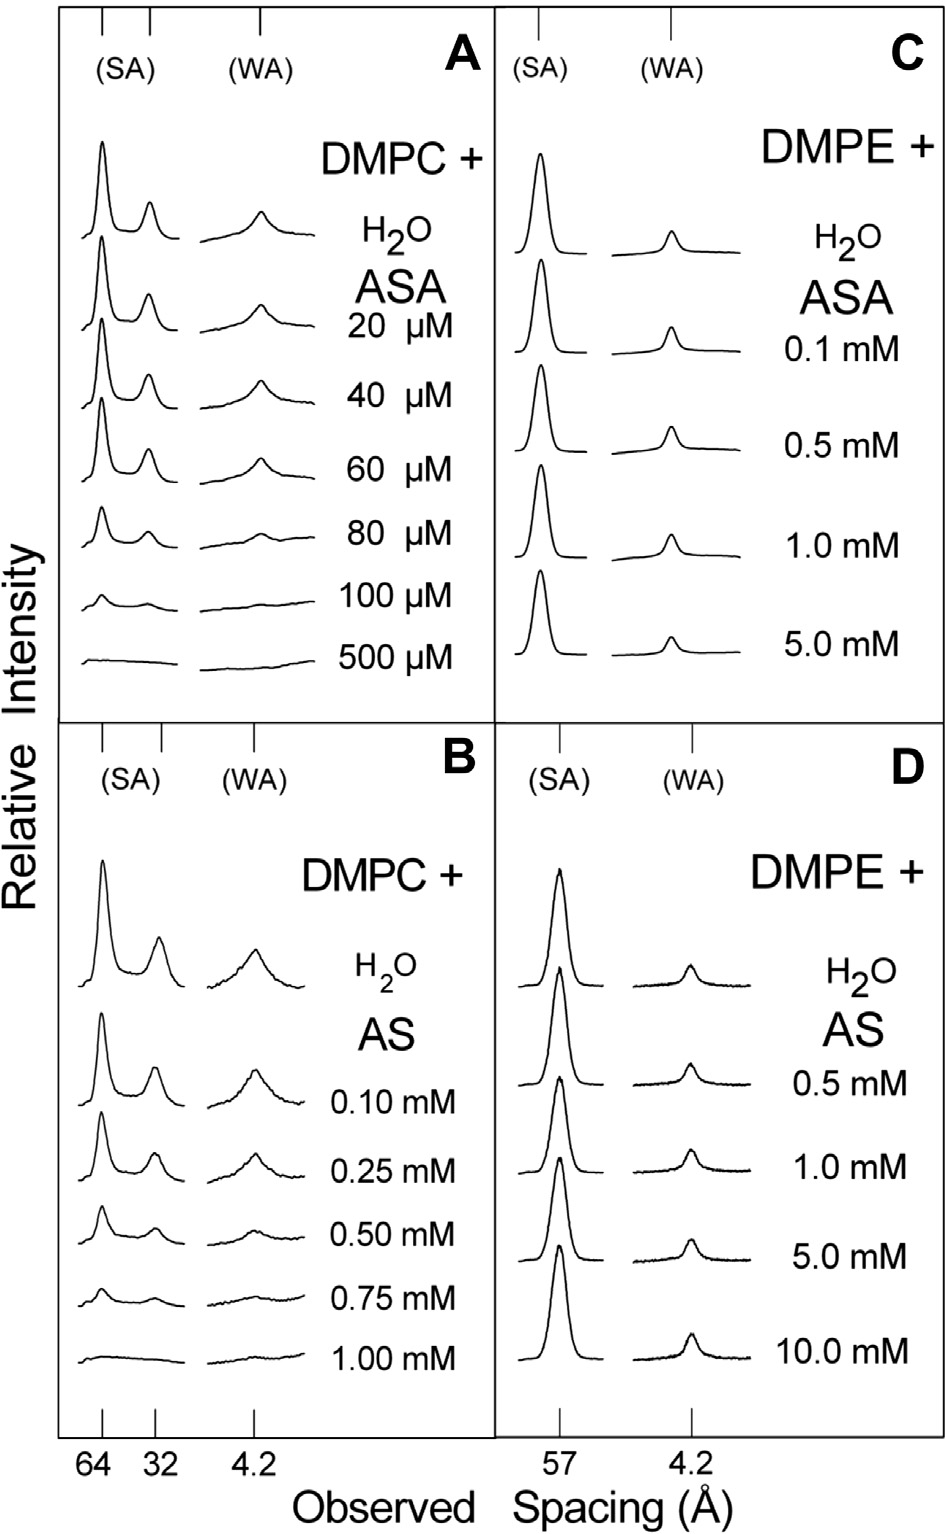
1. Microdensitograms
(1000 rpm � 10 min) and the supernatant was discarded and re-
yristoylphosphatidylcholine (DMPC) in water and aqueous solutions of (A) acetyl-
placed by the same volume of saline solution; the whole process
dimyristoylphosphatidylethanolamine (DMPE) in water and aqueous solutions of
was repeated three times. The sedimentary red blood cells were
(C) ASA, and (D) of SA. (SA) small-angle and (WA) wide-angle reflections.
suspended in 0.9 ml of saline solution and fractions of this stockof red blood cells suspension (RBCS) and saline solution wereplaced in Eppendorf tubes to prepare (a) the control, by mixing
visualized at the microscope. After that, a morphologically normal
100 ll of saline solution plus 100 ll RBCS, and (b) ASA and SA in
erythrocyte was selected with software [11], and the concentration
a range of concentrations (0.02–1.0 mM and 0.1–1.0 mM, respec-
of salicylates was increased. To make three-dimensional recon-
tively) by mixing 100 ll of RBCS with 100 ll of adequate ASA
structions two images were captured in the defocus positions +1
and AS stock solutions in saline solution. All the samples were then
and �1 lm at different ASA and SA concentrations in the RBCS.
incubated for 1 h at 37 °C. After the incubation, samples were cen-
These focus values fulfill the small defocusing approximation and
trifuged (1000 rpm � 10 min) and the supernatant was discarded.
the contrast of the images was obtained and three-dimensional
Then, they were fixed overnight at 4 °C by adding 500 ll of 2.5%
shape reconstruction was directly calculated [11,18].
glutaraldehyde to each one. The fixed samples were washed withdistilled water, placed over Al glass cover stubs, air dried at 37 °Cfor 30 min to 1 h, and gold-coated for 3 min at 10�1 Torr in a sput-
ter device (Edwards S150, Sussex, England). Resulting specimenswere examined in a Jeol SEM (JSM 6380 LB, Japan).
X-ray diffraction studies of DMPC and DMPE multilayers
Defocusing microscopy (DM) studies of human erythrocytes
Fig. 1A exhibits results obtained by incubating DMPC with
water and ASA. As expected, water altered the DMPC structure:
RBCS were obtained from a healthy donor under no pharmaco-
its bilayer repeat (bilayer width plus the width of the water layer
logical treatment. The cells were centrifuged (1000 rpm for 10 m)
between bilayers) increased from about 55 Å in its dry crystalline
and washed three times with Phosphate Buffer Saline (PBS)
form to 64.5 Å when immersed in water (gel phase) and its
1 � pH 7.42 with 1 mg/ml of bovine serum albumine (BSA). RBC
small-angle reflections (SA), which corresponds to the bilayer re-
solution was prepared diluting the washed blood 20 times in a
peat, were reduced to only the first two orders of the bilayer width
solution of PBS and BSA. ASA and SA solutions were prepared in
[19]. On the other hand, only one strong reflection of 4.2 Å showed
the same preparation of PBS and BSA. In order to carry out the
up in the wide-angle region (WA), which corresponds to the dis-
analysis, 1.7 ml of the RBCS was placed in an acrylic cuvette, and
tance between the neighboring planes in the nearly hexagonal
M. Suwalsky et al. / Archives of Biochemistry and Biophysics 539 (2013) 9–19
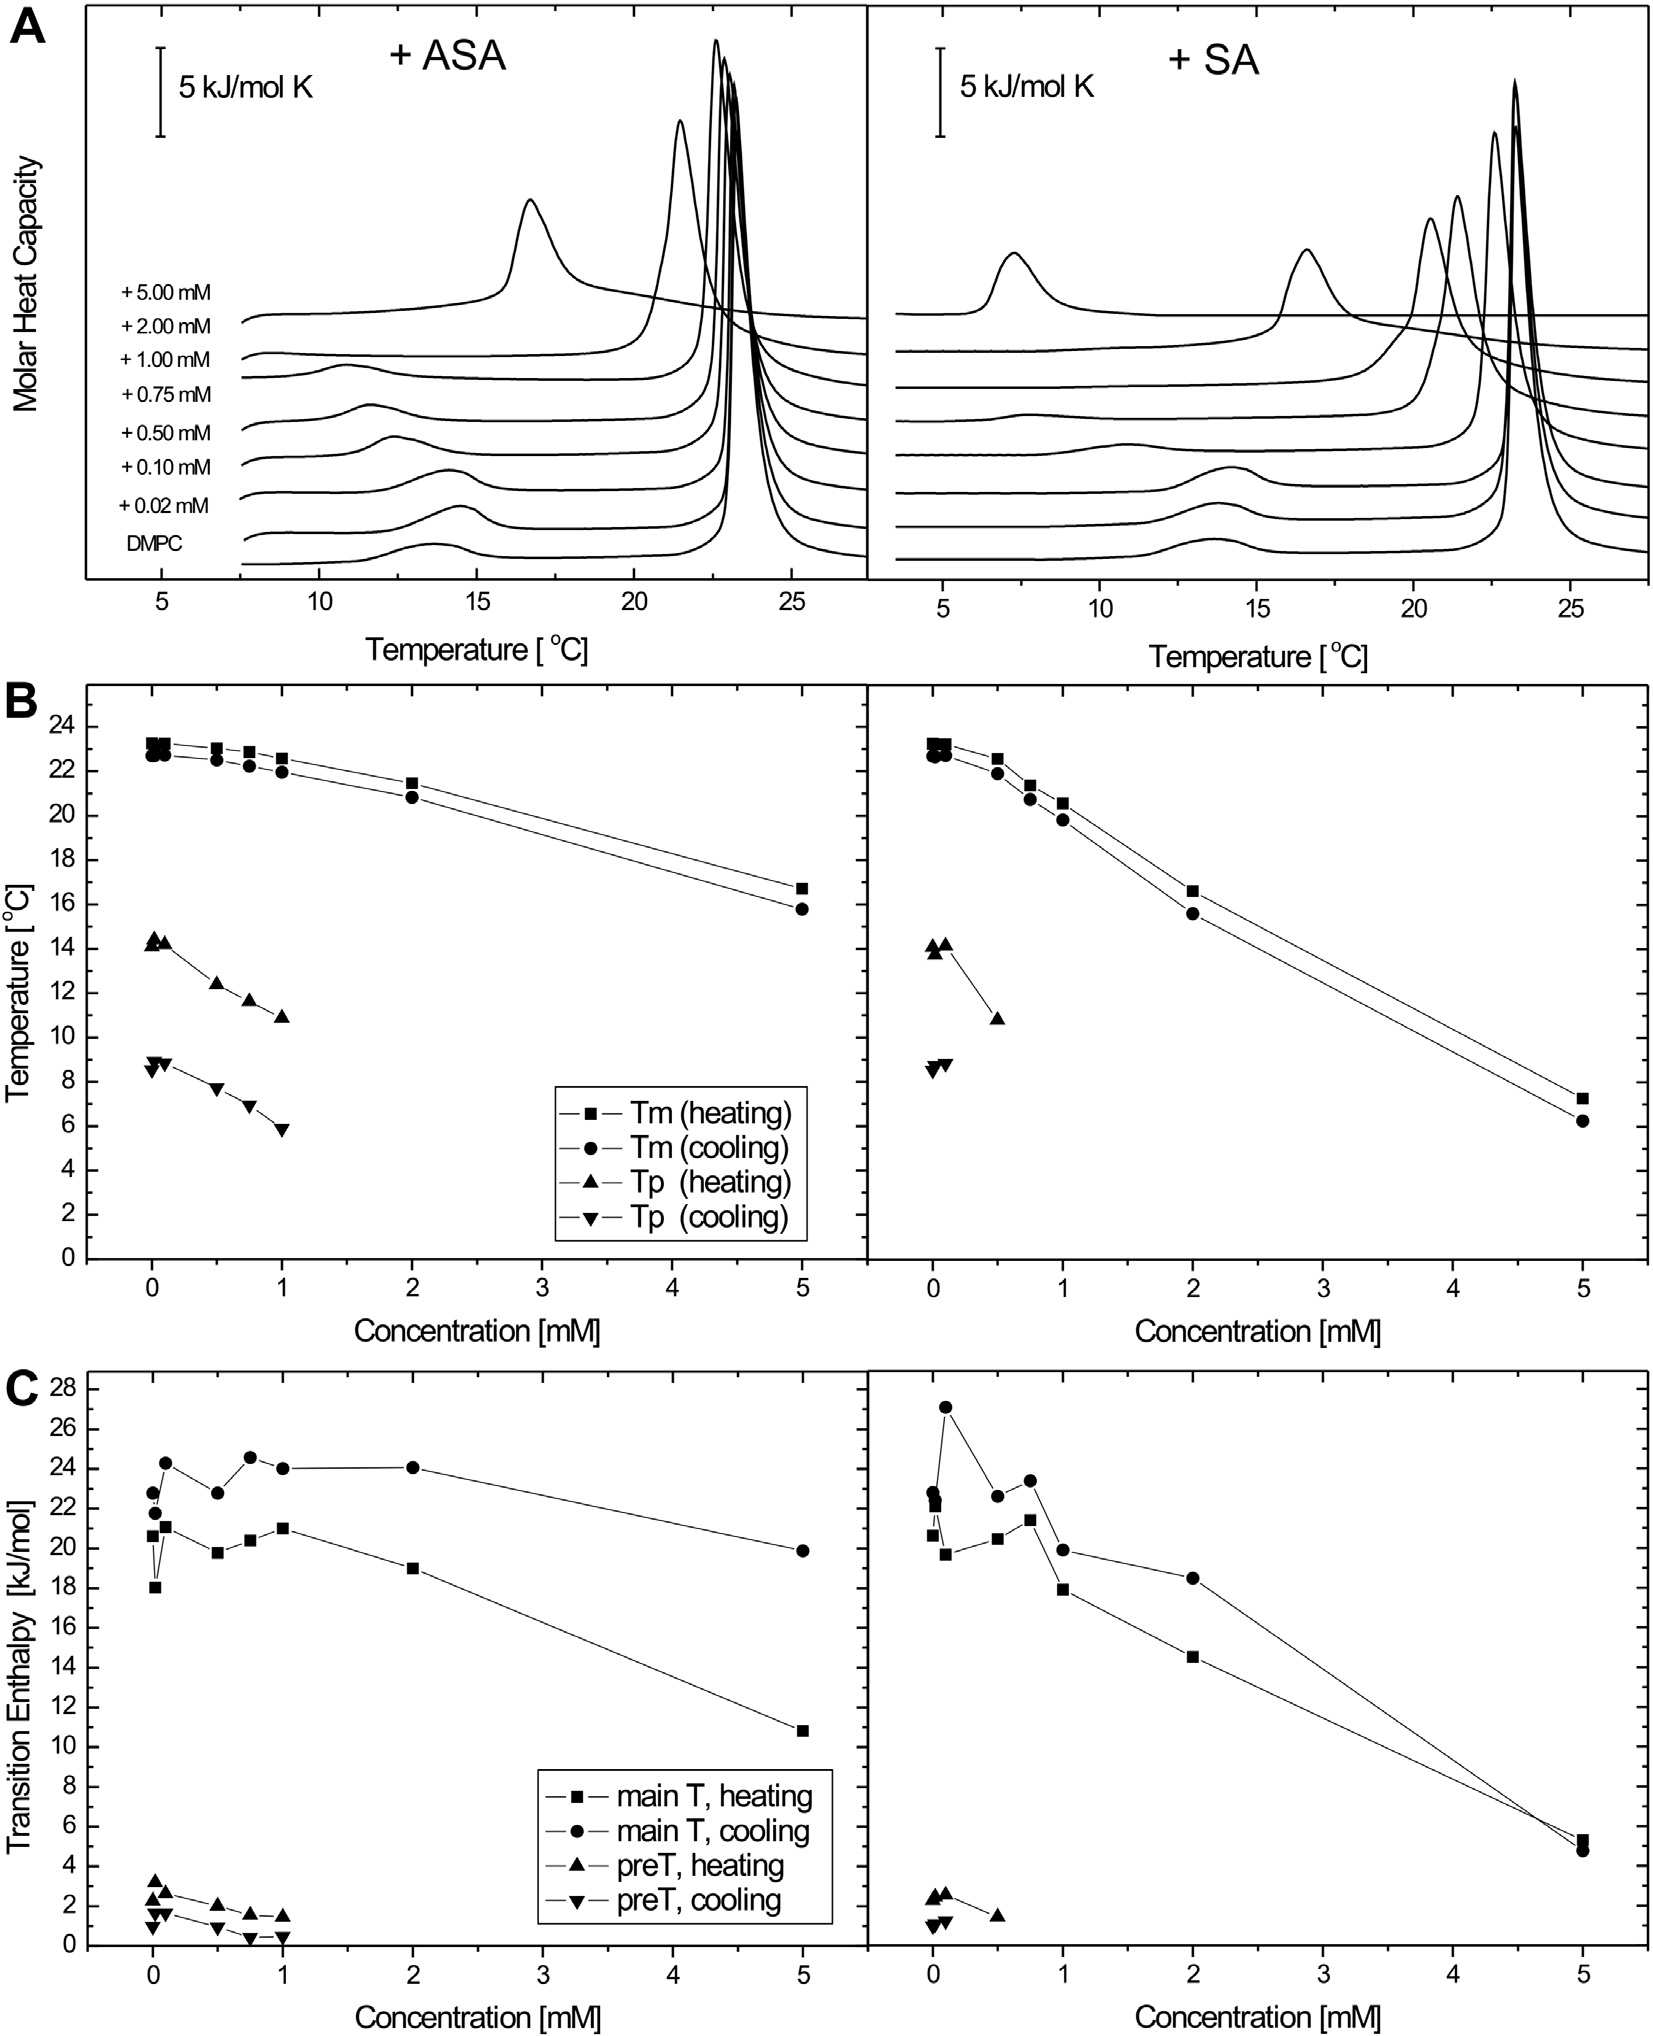
Fig. 2. Set of DSC data obtained for DMPC multilamellar liposomes containing different concentrations of acetylsalicylic acid (ASA) (left panel) and salicylic acid (SA) (rightpanel). Representative DSC curves (A), and a plot of phase transition temperature (B), and transition enthalpy (C) determined for heating and cooling scans as a function ofASA and SA content. Scans were obtained at a heating rate of 1 °C min�1.
packing of the fully extended acyl chains. These results were indic-
with the 0.5 mM ASA. Fig. 1C shows the results of the X-ray diffrac-
ative of the changes in layer and chain packing structure reached
tion analysis of DMPE bilayers incubated with water and ASA. As
by DMPC bilayers. Fig. 1A discloses that after being exposed to
reported elsewhere, water did not significantly affect the bilayer
80 lM ASA there was a considerable weakening of the small-
structure of DMPE [19]. Fig. 1C and D show that increasing concen-
and wide-angle lipid reflection intensities (indicated as (SA) and
trations of ASA and SA did not cause any significant weakening of
(WA) in the figure, respectively) which at 0.5 mM practically disap-
DMPE reflection intensities, all of which still remained even with
peared. From these results it can be concluded that ASA produced a
5 mM ASA and 10 mM SA.
significant structural perturbation of DMPC bilayers. On the otherhand, Fig. 1B shows the results of the X-ray diffraction analysis
Differential scanning calorimetry (DSC) studies of phospholipid model
of DMPC bilayers incubated with water and SA. Fig. 1B shows that
increasing concentrations of SA also induced a weakening of thesmall- and wide-angle reflections, however at somewhat higher
All heating profiles of the binary systems of phospholipids/ASA
concentrations than ASA. In fact, the complete perturbation of
and phospholipids/SA multilamellar vesicles were referred to those
DMPC bilayer arrangement was achieved with 1 mM SA compared
made of pure lipids. Fig. 2A reports the typical heating curves
M. Suwalsky et al. / Archives of Biochemistry and Biophysics 539 (2013) 9–19
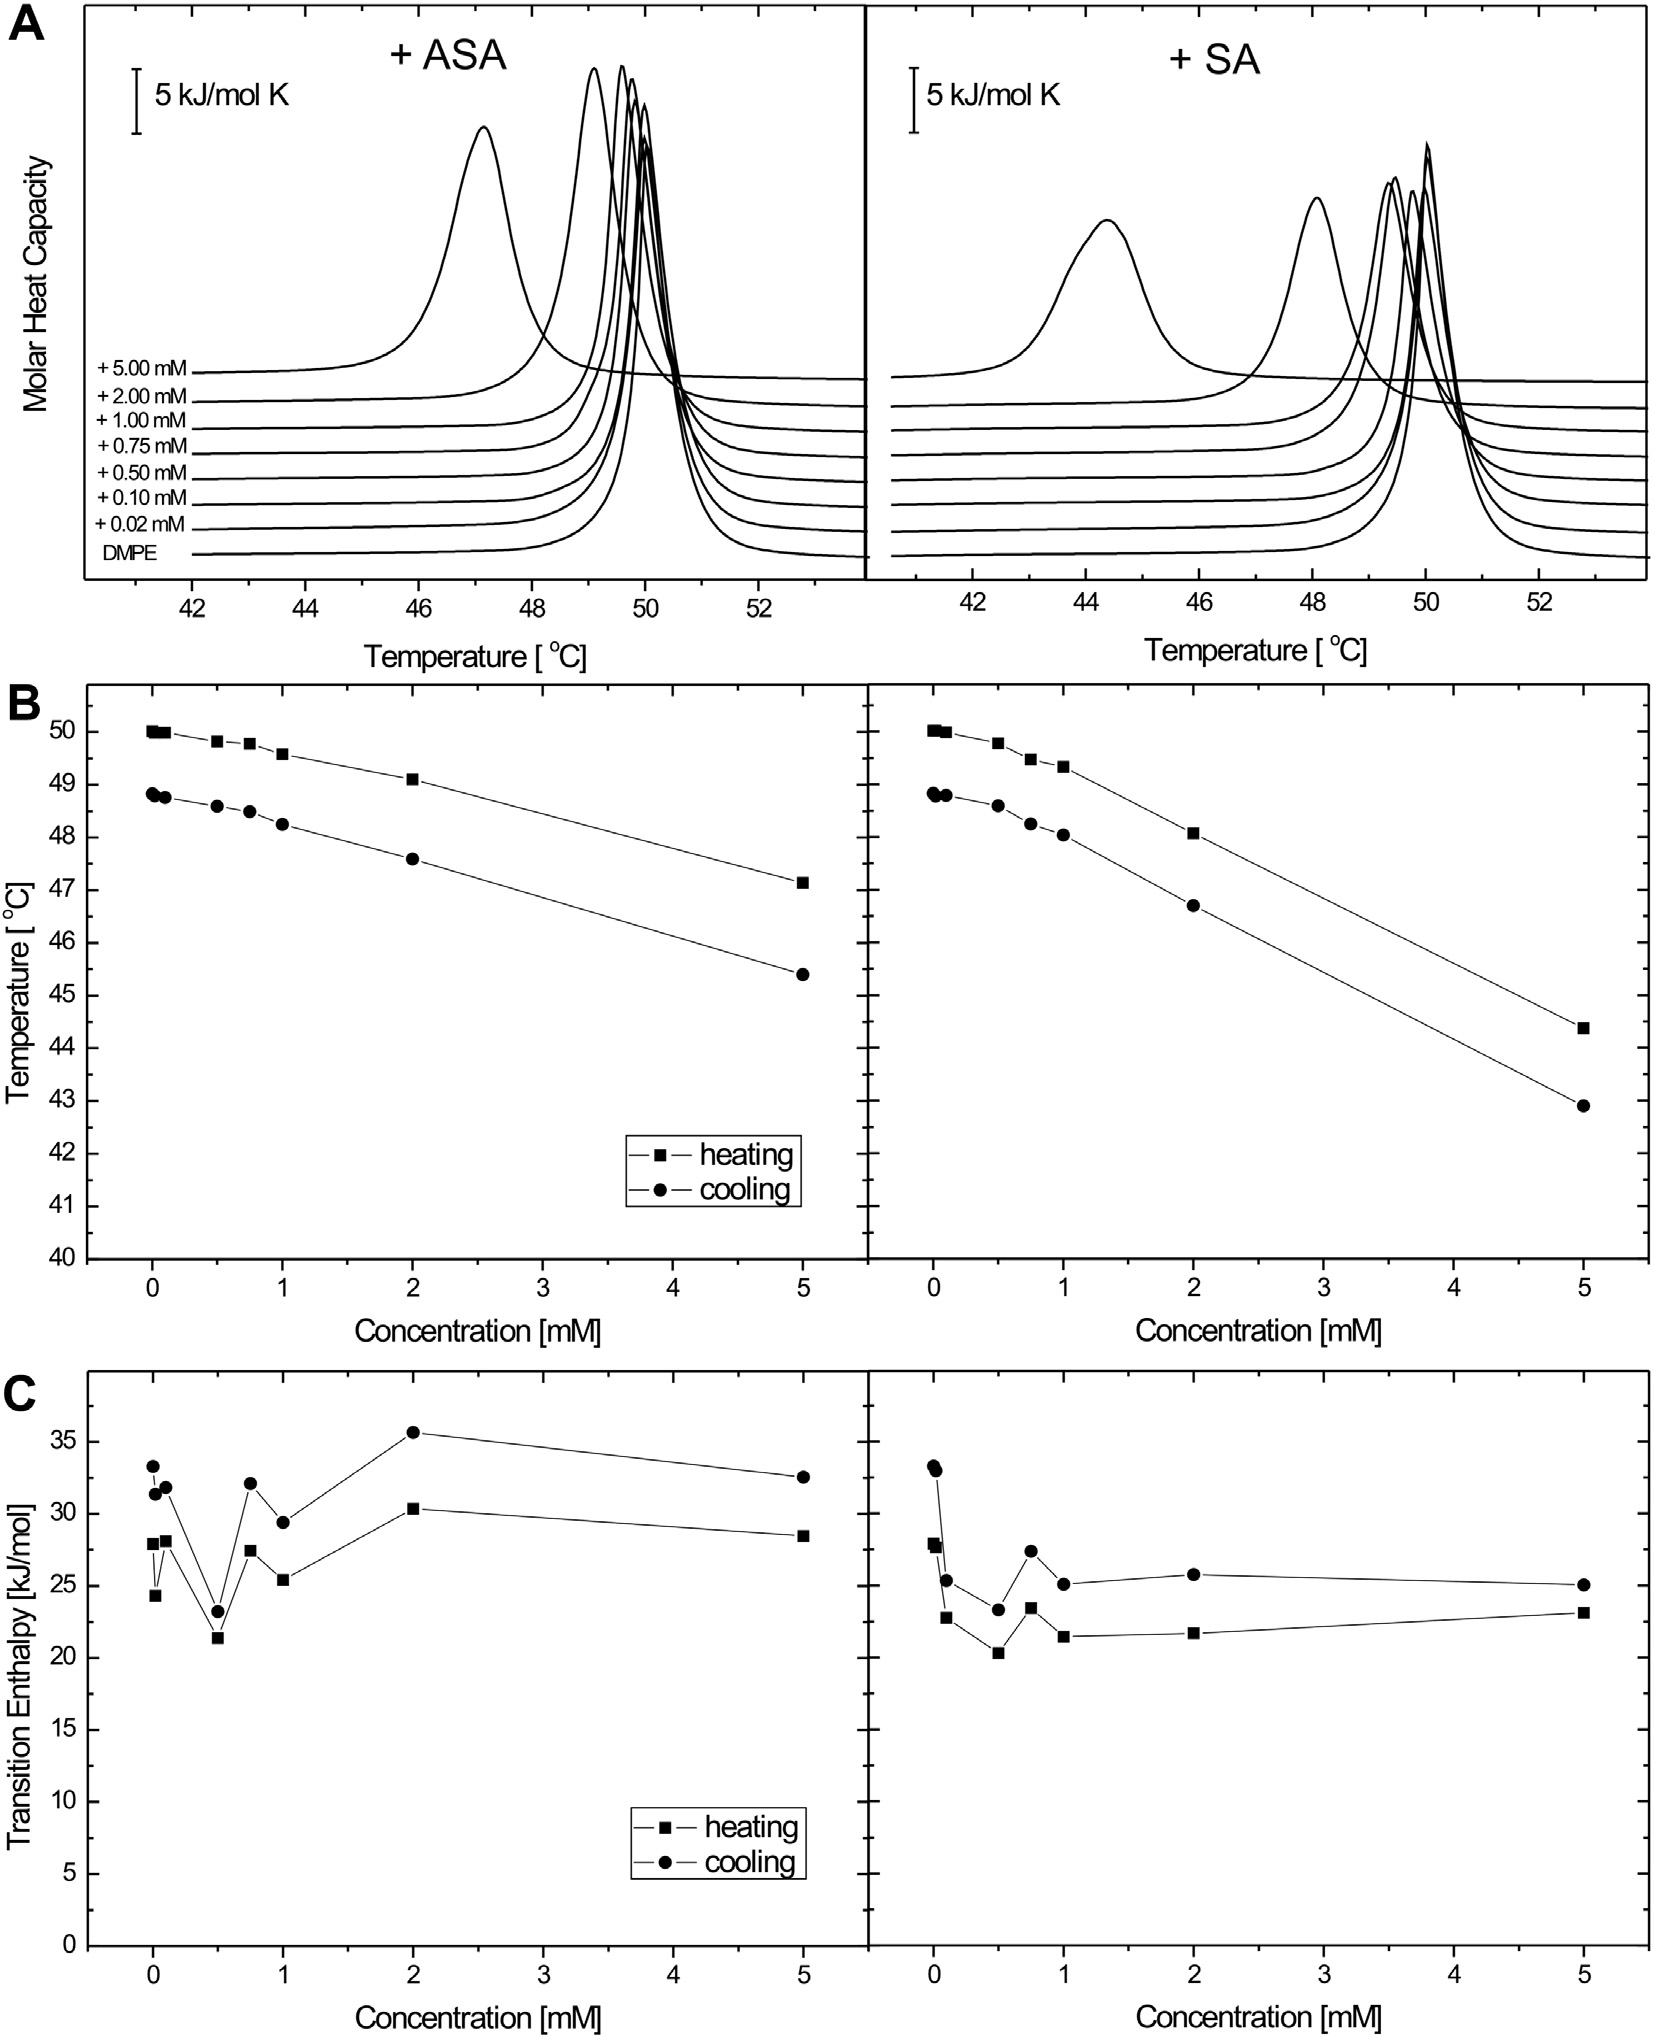
Fig. 3. Set of DSC data obtained for DMPE multilamellar liposomes containing different concentrations of acetylsalicylic acid (ASA) (left panel) and salicylic acid (SA) (rightpanel). Representative DSC curves (A), and a plot of phase transition temperature (B), and transition enthalpy (C) determined for heating and cooling scans as a function ofASA and SA content. Scans were obtained at a heating rate of 1 °C min�1.
obtained for DMPC liposomes containing different concentrations
the phase transition temperatures, the calorimetric enthalpy as
of ASA and SA. The first heating profile corresponds to the values
well as transition entropy (Table 1). The first parameter, Tm, is an
of thermal parameters obtained for fully hydrated DMPC bilayers
expression of changes in membrane fluidity, i.e. the passage of a
in the absence of any additives, where the pretransition tempera-
certain number of aliphatic chains from an ordered to a disordered
ture (Tp = 14.09 °C) and the main phase transition temperature
state. The analysis of the variation of Tm values with increasing
(Tm = 23.27 °C) are in agreement with the previously published
amounts of ASA and SA in DMPC multibilayers is shown in
data [20–22]. The highly cooperative main transition (Pb0 ? La
Fig. 2B. It is clear that SA has the higher perturbing effect on the
phase transition) with an enthalpy change (DH) of 20.62 kJ mol�1
membrane fluidity than ASA. The second thermodynamic parame-
corresponds to the gel-to-liquid–crystal transition, while the smal-
ter presented in Fig. 2C is the enthalpy change associated with the
ler one (Lb0 ? Pb0 phase transition) with a DH of 2.27 kJ mol�1 is
phase transition which was calculated by integrating the peak area
called pretransition. On the basis of the measured heating curves,
after baseline adjustment and normalization to the amount of sam-
the thermodynamic parameters referred to as essential for the
ple analyzed. The total enthalpy change associated with the lipid
description of drug–phospholipid interactions were calculated:
chain melting is related to molecular packing of the acyl chain.
M. Suwalsky et al. / Archives of Biochemistry and Biophysics 539 (2013) 9–19
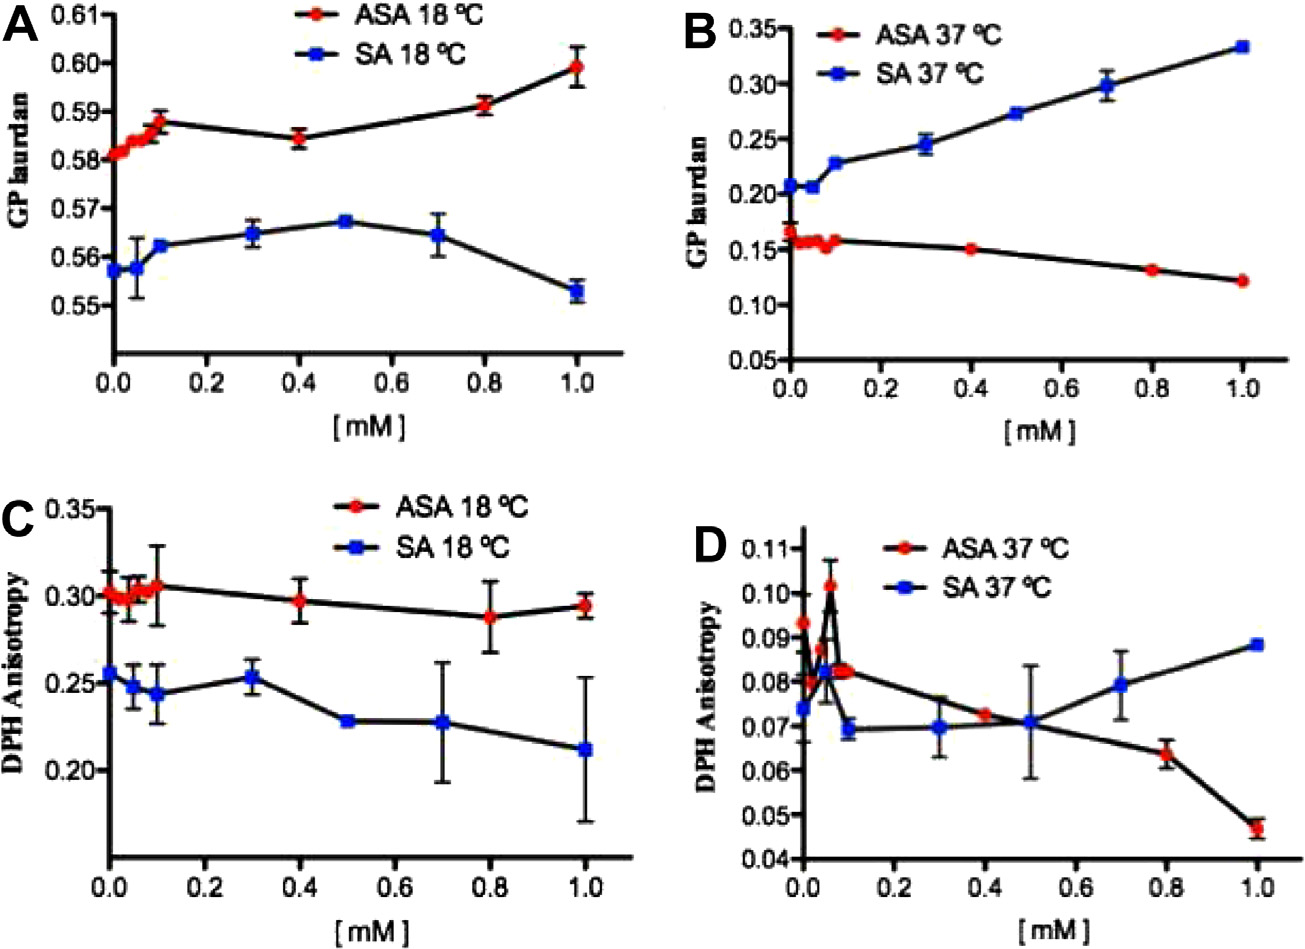
Fig. 4. Effects of acetylsalicylic acid (ASA) and salicylic acid (SA) on the generalized polarization (GP) of laurdan at 18 °C (A), at 37 °C (B), and on the anisotropy (r) of DPH at18 °C (C) and 37 °C (D) embedded in DMPC large unilamellar vesicles (LUV).
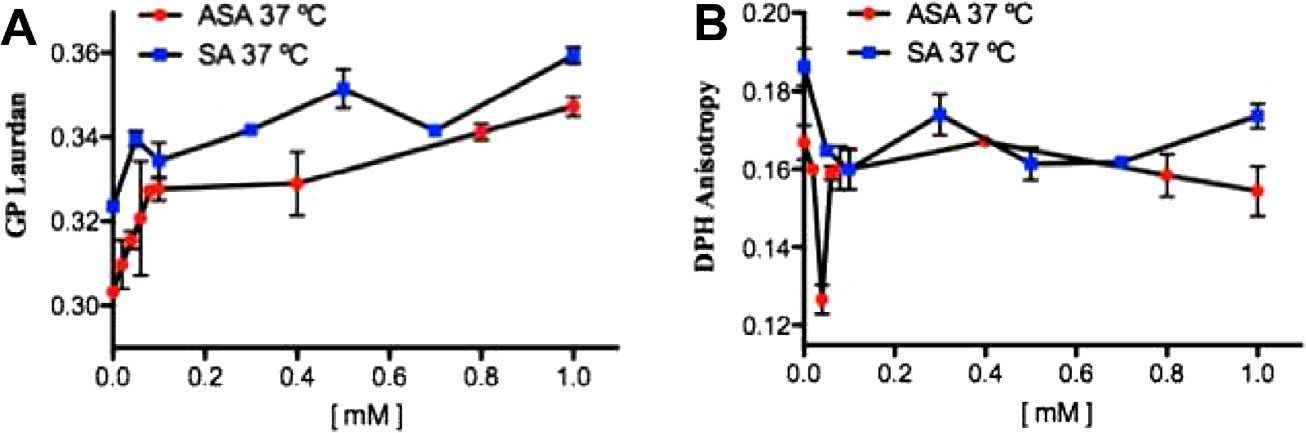
Fig. 5. Effects of acetylsalicylic acid (ASA) and salicylic acid (SA) on isolated unsealed human erythrocyte membranes (IUM) at 37 °C. (A) Generalized polarization (GP) oflaurdan in ASA and SA; (B) anisotropy (r) of DPH in ASA and SA.
Thus, compounds entering the bilayer should lower the stability of
Fluorescence measurements of large unilamellar vesicles (LUV) and of
the lipid matrix with a decrease in both Tm and DH of the gel to li-
isolated unsealed human erythrocyte membranes (IUM)
quid crystal transition phase. However, in spite of the observed Tmchanges, the incorporation of ASA and SA does not significantly
The concentration-dependent effect of ASA and SA was ex-
influence the DH at the concentrations lower than 2 mM and
plored at two different depths of DMPC and of the human eryth-
0.75 mM for ASA and SA, respectively. Fig. 3A shows the set of rep-
resentative heating profiles obtained for DMPE liposomes. In the
estimated from the laurdan fluorescence spectra shift through
thermal range of 30–70 °C, the pure DMPE bilayers exhibit a strong
the GP parameter, and in the deep hydrophobic core determined
and sharp main-transition at 50.02 °C, with an enthalpy change of
by DPH steady-state fluorescence anisotropy (r). These effects
27.91 kJ mol�1, arising from the conversion of gel to liquid–crystal
were assayed at 18 °C and 37 °C. As shown in Fig. 4A, very low
phase. The transition is reversible and the shape of the peak is
ASA concentrations induced an increase of GP in DMPC LUV at
roughly symmetrical. Thermodynamical parameters found for
18 °C. This effect can be interpreted as an acute structural order-
DMPE are concurrent with the literature data [23]. The effective-
ing of the polar head group region of the DMPC bilayer. However,
ness in perturbations of DMPE thermotropic phase transition ex-
at 37 °C the opposite effect was produced (Fig. 4B). Different re-
erted by examined compounds was further analysed in terms of
sults were observed for SA, as GP values tended to decrease at
thermodynamic parameters. Table 2 presents values of tempera-
18 °C (Fig. 4A) and increase at 37 °C (Fig. 4B). Fig. 4C does not
ture, enthalpy and entropy for DMPE/ASA and DMPE/SA systems,
show significant differences in DPH anisotropy between ASA and
determined on the basis of heating and cooling scans. Similarly
SA at 18 °C. However, a biphasic pattern is observed at 37 °C
to phospholipids containing choline group, DMPE bilayers are af-
(Fig. 4D) when the bilayer is in a fluid liquid crystalline state: ini-
fected by the presence of ASA and SA as the phase transition tem-
tial increase of this parameter occurred up to 0.1 mM salicylates
perature undergoes the shift to the lower values in the
followed by a sharp decrease. These results imply that both ASA
concentration-dependent manner (Fig. 3B). However, contradic-
and SA first ordered the phospholipid acyl chain packing arrange-
tory to DMPC, any pronounced changes of DH are not observed
ment and afterwards disordered them as the salicylate concentra-
even for high ASA and SA contents in the liposomes (Fig. 3C).
tions decreased; however, ASA and SA induced opposite effects at
M. Suwalsky et al. / Archives of Biochemistry and Biophysics 539 (2013) 9–19
Table 1Thermodynamic parameters of the pretransition and main phase transition of pure fully hydrated DMPC multilamellar liposomes, DMPC/SA and DMPC/ASA mixtures determinedfrom heating and cooling scans collected at a heating (cooling) rate of 1 °C min�1. The accuracy for the main phase transition temperature and enthalpy was ±0.1 °C and ±0.8 kJ/mol, respectively.
Pretransition heating
Main transition heating
Pretransition cooling
Main transition cooling
a – Abolished.
Table 2Thermodynamic parameters of the phase transition of pure, fully hydrated DMPE multilamellar liposomes, DMPE/SA and DMPE/ASA mixtures determined from heating andcooling scans collected at a heating (cooling) rate of 1 °C min�1. The accuracy for the main phase transition temperature and enthalpy was ±0.1 °C and ±0.8 kJ/mol, respectively.
higher concentrations. Fig. 5 shows the concentration-dependent
bated with SA also showed echinocytosis. However, this condition
effect of ASA and SA at 37 °C on the generalized polarization of
was attained at much higher concentrations (0.25 mM–0.75 mM
laurdan and anisotropy of DPH embedded in IUM. Whereas both
ASA and SA induced sharp GP increase at low salicylate concentra-tions (Fig. 5A), quite the opposite effect is observed in the DPHanisotropy (Fig. 5B). Nevertheless, ASA induced somewhat more
Defocusing microscopy (DM) studies of human erythrocytes
profound effects than SA.
Fig. 8 shows defocusing microscopy experiments of human red
blood cells exposed to different ASA concentrations. ASA induced
Scanning electron microscopy (SEM) studies of human erythrocytes
the transformation of the normal discoid morphology of the eryth-rocytes to echinocytes in the lM range (Fig. 8B). At 100 lM con-
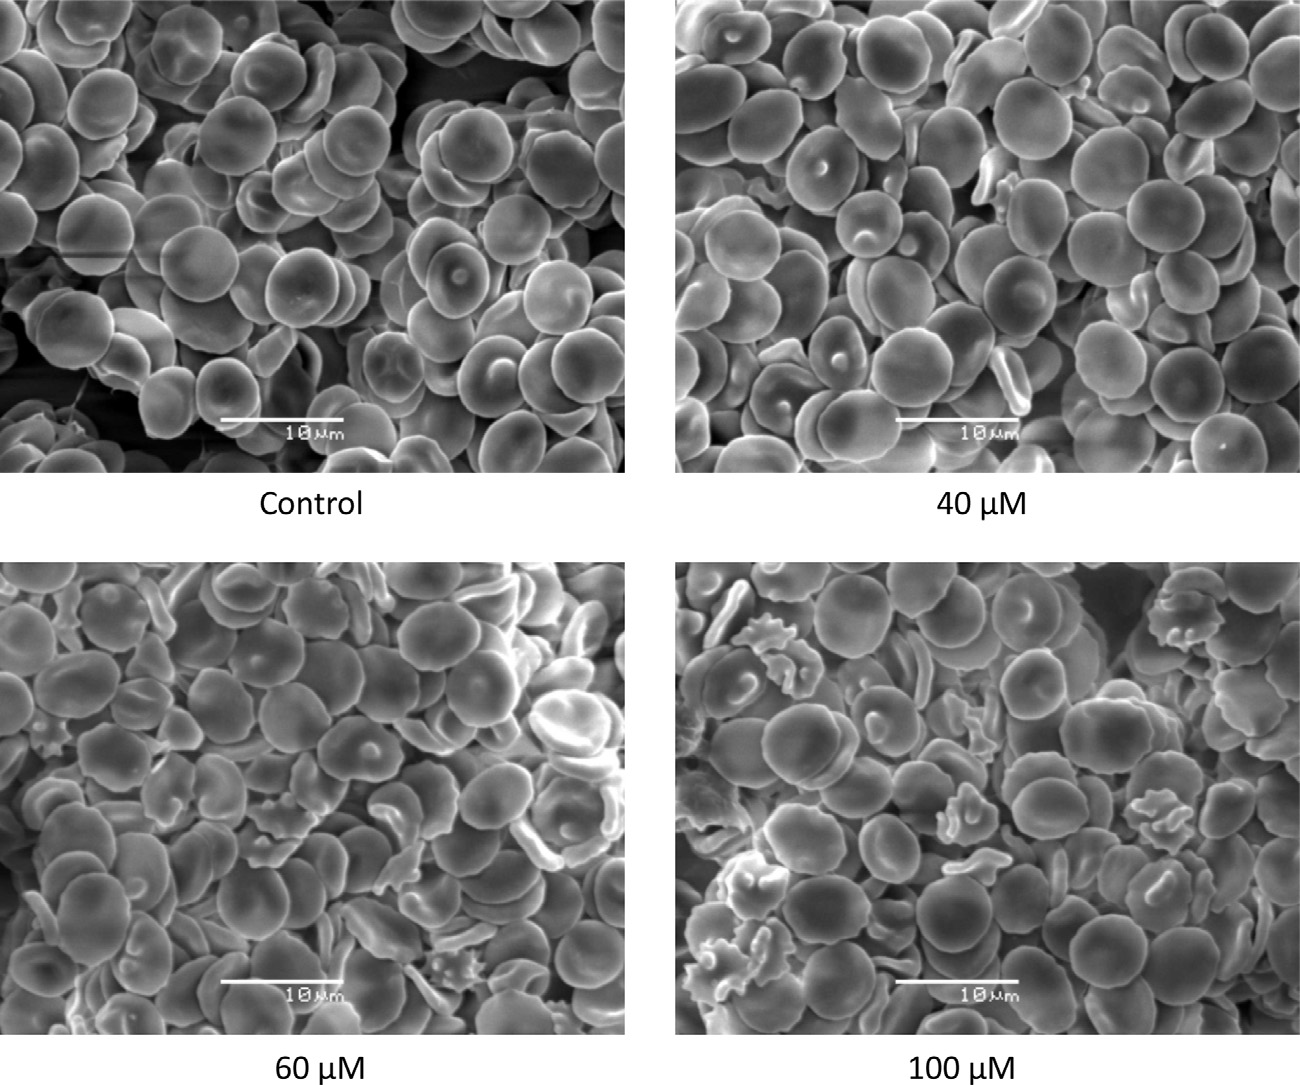
SEM examinations of human erythrocytes incubated with ASA
centration, a third of the erythrocytes population was affected
in the range 40–100 lM indicated that it induced echinocytosis.
with echinocytosis (Fig. 8). Fig. 9 shows defocused images of hu-
In that altered condition, red blood cells lost their normal profile
man red blood cells exposed to different concentrations of SA. This
and presented a spiny configuration with blebs in their surfaces
acid also induced the transformation of the erythrocytes to
(Fig. 6). The extent of these changes was dependent on the ASA
echinocytes. However, this condition was attained at higher con-
concentration. As it can be observed in Fig. 7 erythrocytes incu-
centrations that those of ASA.
M. Suwalsky et al. / Archives of Biochemistry and Biophysics 539 (2013) 9–19
Fig. 6. Effects of acetylsalicylic acid (ASA) on the morphology of human erythrocytes. SEM images of untreated erythrocytes (control), and incubated with 40 lM, 60 lM, and100 lM ASA.
Fig. 7. Effects of salicylic acid (SA) on the morphology of human erythrocytes. SEM images of untreated erythrocytes (control), and incubated with 0.25 mM, 0.5 mM, and0.75 mM SA.
erythrocyte membrane [24–27]. In order to understand these ef-fects, salicylates under the form of ASA and SA were incubated
It becomes remarkable that after so many studies on salicylate
with intact erythrocytes, their isolated unsealed membranes
toxicity there are scanty recent reports on the structural effects
(IUM) and bilayers of DMPC and DMPE, phospholipid classes
induced by acetylsalicylic (ASA) and salicylic acids (SA) to the
present in the outer and inner monolayers of the erythrocyte
M. Suwalsky et al. / Archives of Biochemistry and Biophysics 539 (2013) 9–19
plained on the basis of the different nature of DMPC and DMPE,and of ASA and SA. Chemically the two lipids only differ in theirterminal head groups, these being +N(CH3)3 in DMPC and +NH3 inDMPE. Moreover, both molecular conformations are very similarin their dry crystalline phases: their acyl chains are mostly paralleland extended with the polar groups lying perpendicularly to them;however, DMPE molecules pack tighter than those of DMPC. Thiseffect, due to DMPE smaller polar group and higher effectivecharge, stands for a very stable multilayer arrangement that isnot significantly perturbed by the presence of water [19]. On theother hand, the gradual hydration of DMPC bilayers leads to waterfilling the highly polar interbilayer spaces. Consequently, there isan increase in its bilayer width from 54.5 Å when dry (crystallinephased) up to 64.5 Å when fully hydrated (gel phase) at a temper-ature below that of its main transition [19]. This condition pro-moted the incorporation of ASA and SA into DMPC highly polarinterbilayer space and the ensuing molecular perturbation of thephospholipid bilayer structure.
Fig. 8. Effects of acetylsalicylic acid (ASA) on human erythrocytes. (A) Defocused
It has been suggested that the variation in both efficacy and tol-
images of untreated erythrocytes (control), and incubated with 100 lM ASA. (B) 3-
erability of drugs are partly due to their differences in their physi-
Dimensional reconstruction of control erythrocytes with 40 lM, 60 lM and 100 lMASA.
cochemical properties (e.g. ionization constants (pKa), solubility,partition coefficients), which determine their distribution in thebody. Thus, we made an effort to explain the structural effect ofsalicylates on the human erythrocyte membrane and molecularmodels based on such approach. The lipid solubility of a drug, ex-pressed traditionally by the octanol/water partition coefficient,log (Poct), is widely applied to liposome/water systems and remainsa primary feature accounting for quantitative structure/activityrelationship studies (QSAR) [29]. Partition coefficient determinesdrug distribution between the aqueous and lipid phases, and there-by the extent of penetration into the membrane and/or interactionswith phospholipids or other membrane components. The higherpartition coefficient found for SA (log (Poct) = 2.26) in comparisonto ASA (log (Poct) = 1.19) [30] can be explained on the basis of theirchemical structures. The phenolic character of SA confers it a muchhigher lipophilic character. This, in turn, alters the steric hindranceand electron properties and consequently modulates the partitionof drugs into lipid bilayers. Recently, Zhou and Raphael [5] esti-mated the free energy of transfer for salicylate insertion into themembrane and the corresponding partition coefficient into a SOPCmembrane (log (Pmem) � 2.1) proving favorable salicylate-mem-brane interactions. Salicylates with pKa values of 3.49 (ASA) and
Fig. 9. Effects of salicylic acid (SA) on human erythrocytes. (A) Defocused images of
2.79 (SA), [21], in a nearly neutral solution would exist predomi-
untreated erythrocytes (control), and incubated with 1 mM SA. (B) 3-Dimensional
nantly as an anion, which can have unfavorable electrostatic inter-
reconstruction of control erythrocytes with 0.25 mM, 0.5 mM and 1 mM SA.
actions with lipids. The additional hydroxyl group on SA may leadto more favorable interactions with the aqueous solution.
membrane, respectively. Salicylates are composed of a nonpolar
In this work, taking advantage of DSC, we have shown that both
benzene ring and a polar domain consisting of hydroxyl- and car-
ASA and SA are able to modify to various extents thermotropic
boxyl-functional groups. For the sake of this amphiphilic structure
properties of DMPC bilayer and can act as mild chaotropic agents
both SA and its acetyl derivative ASA might be expected to pene-
[31]. Regardless the form, they affected pretransition as well as
trate into biomembranes and alter their physical properties.
caused broadening of main phase transition and decreased its tem-
Accordingly, analysis by X-ray diffraction showed that 80 lM and
perature. From Fig. 2A it appears evident that upon heating the
higher concentrations of ASA induced structural perturbations of
pretransition peak becomes progressively smaller and disappears
the polar head and the hydrophobic acyl regions of DMPC, whose
as the content of salicylates in the membrane increases. Addition
bilayer structure completely collapsed with 0.5 mM ASA. These re-
of SA at concentrations higher than 0.5 mM resulted in the com-
sults are in agreement with the report published by Barret et al.
plete disappearance of the pretransition peak, which in the case
[28], who also used X-ray diffraction to study the interaction be-
of ASA was still observed up to 1 mM. Interestingly, the changes
tween ASA and DMPC bilayer [28]. From 2D X-ray intensity maps
in the pretransition occurred even faster than the changes in the
they determined in-plane and out-plane structure of the mem-
main phase transition which means that salicylates have stronger
brane in their gel (Lb) phase and present the first experimental
influence on DMPC membranes in the gel phase than in liquid–
proof that ASA participate in lipid bilayers. On the other hand, SA
crystalline phase. Furthermore, it indicates a surface-disordering
induced significant structural changes to DMPC but at considerably
effect of these drugs since pretransition is sensitive to the presence
higher concentrations. When these experiments were repeated
of guest molecules in the polar region [32]. Consequently, Khand-
with DMPE, increasing concentrations of ASA and SA did not cause
elia and co-workers using extensive molecular dynamics simula-
any significant effect on DMPE bilayer structure even with 5 mM
tions showed that the hydroxyl and carboxyl moieties of SA
and 10 mM concentrations, respectively. These results can be ex-
interacted preferentially with the choline group of DMPC and there
M. Suwalsky et al. / Archives of Biochemistry and Biophysics 539 (2013) 9–19
were no other specific interactions between SA and phospholipid
between membrane fluidity and conformational changes of pro-
molecules [33]. Based on 2D X-ray intensity map for ASA in DMPC
teins. Notwithstanding the fact that our X-ray diffraction studies
membrane, direct experimental evidence was provided that ASA is
have not revealed disruption of tightly packed DMPE bilayers in
present in saturated lipid bilayers and preferably resides in the
the presence of either ASA or SA, it was observed by DSC perturba-
head group region [28]. In particular, ASA molecule was fitted
tion of its thermotropic properties. This method detects the ab-
along bilayer normal (z) at the position (relative to the bilayer cen-
sorbed heat by the entire bilayer, and hence it provides
tre) of 16 Å < z < 21 Å, with the hydrophilic, electron-richer oxygen
information about the bulk properties and long-range order of
groups at a z position of �21 Å, facing the hydration water. As a re-
the bilayer. The most distinct difference between the effects dis-
sult of such orientation, the hydrophobic part of the ASA molecule
played by the drug molecules on PC and PE membranes can be no-
is shielded from the aqueous environment. It is most likely that the
ticed from Fig. 3C as there is no clear concentration dependence of
lower electron density towards the center of the bilayer it is point-
transition enthalpy. A study on the lipid thermotropic properties
ing to an increased disorder of the lipid tails, i.e., a higher number
and fluidity has been previously performed on a mixed dipalmi-
of gauche defects in the hydrocarbon chains. This conclusion sup-
toylphosphatidylcholine (DPPC) and dipalmitoylphosphatidyletha-
ported by the observation of larger tilt angle of the lipid tails in the
nolamine (DPPE) system [41]. In line with our above-mentioned
experiments conducted by Barret et al. [28] is in line with our DSC
results, the authors concluded that SA molecules were probably lo-
studies. The results obtained revealed that the thermotropic prop-
cated in the lipid–water interfacial region neighboring the lipid
erties of the membrane were altered by the presence of salicylates
head groups or the glycerol moiety and acting as a membrane flu-
and these effects were concentration dependent. For low drug con-
idizer. Additionally, a phase separation (DPPC-rich and DPPE-rich
centration (<0.5 mM), the thermotropic properties were only
phases) was observed at high drug concentration.
slightly modified suggesting that the drug molecules although lo-
Apart from some structural changes in the lipid molecules and
cated near the lipid–water interface non-significantly affected
systematic alterations in the bilayer geometry that accompany
the lipid interactions. However, higher drug concentration led to
the phospholipids main phase transition, the most characteristic
so drastic shifts of Tm as 16.0 °C and 6.57 °C in the presence of
feature of this process is the trans-gauche isomerization in the acyl
5 mM concentration of SA and ASA, respectively. Moreover, signif-
chains. The average number of gauche conformers, in turn, ac-
icant broadening of the transitions was observed (Fig. 2A), which is
counts for the effective fluidity, which depends not only on the
an indication of a reduction of cooperativity between the lipid acyl
temperature, but also on perturbations due to the presence of a
chains. The variation in the DH values showed in Fig. 2C can be ex-
drug molecule intercalating between the lipids [35]. Following this
plained by the type of interaction between the guest molecules and
reasoning, we performed complementary steady-state fluores-
lipids. In fact, the compounds can interact with lipids intercalating
cence anisotropy and general polarization studies. Our results on
between them, which results in Tm variations but without DH
DMPC LUV indicated that ASA induced significant changes in both
changes or taking the place of lipid molecules and causing both
the hydrophilic polar group and hydrophobic domain of the lipid
Tm lowering and DH decrease. From 2D X-ray intensity map [28]
acyl chains in the gel (18 °C) and liquid crystalline (37 °C) phases
it is seen that while 40 mol% ASA could be dissolved in the DMPC
in a concentration as low as 20 lM. On the other hand, SA also
bilayer, 50 mol% ASA lead to a non-physiological, highly ordered
changed the ordering of DMPC polar head and acyl chain regions
state. Thus, if one assume that it marks the solubility limit of
in both phases, although with higher SA concentrations; moreover,
ASA in saturated lipid membranes giving rise to a structure in
its effects were somewhat different from those exhibited by ASA as
which each lipid molecule ‘‘hosted'' one ASA molecule, the forma-
it can be appreciated in Fig. 4. Both salicylates also affected,
tion of aggregates at higher salicylate concentrations could not be
although in a rather similar manner, both regions of the lipid bi-
excluded. Indeed, the idea of salicylate forming dimers is not unu-
layer present in isolated human erythrocyte membranes (IUM)
sual, as the carboxyl and hydroxyl groups covalently attached to
salicylate aromatic ring can participate in H-bonding with those
According to the bilayer couple hypothesis [42,43], shape
on the adjacent molecule(s). Such behavior was previously sug-
changes are induced in red cells due to the insertion of foreign spe-
gested to explain salicylates ability to induce micellar chain forma-
cies in either outer or inner monolayer of the erythrocyte mem-
brane. Thus, spiculated shapes (echinocytes) are observed in the
The membrane localization of SA has also been investigated by
first case while cup shapes (stomatocytes) are produced in the sec-
DSC in DPPC bilayers in which SA molecules were showed to reside
ond due to the differential expansion of the corresponding mono-
near the upper hydrophobic part of the lipid core (C1–C8 region of
layer. Given the extent of the interaction of ASA and SA with DMPC,
the acyl chain) [35]. The authors speculate that this preferential
class of lipid preferentially located in the outer monolayer of the
location may be a prerequisite for the subsequent binding to a
erythrocyte membrane, echinocytes were expected from erythro-
proximal cleft of the transporter protein. This binding in turn
cytes incubated with both salicylates. SEM and DM examination
might result in conformational changes of the transporter protein
of specimens showed that in fact ASA and SA induced a change
altering its function. This is of great importance as SA was shown
of the normal biconcave erythrocytes into echinocytes, whose
to inhibit anion exchange of sulfate in erythrocyte membranes
number increased with higher concentrations. However, ASA ex-
[36]. Moreover, based on the results of fluorescence studies [35]
erted these changes of shape at a considerable lower concentration
displaying a pronounced effect of SA on membrane fluidity, an-
(40 lM) than that of SA (0.25 mM).
other mechanism could be suggested in which increasing fluidity
It is well known that salicylate is in vivo rapidly formed after the
interferes with an essential conformational transition of the trans-
administration of acetylsalicylic acid and then accumulates during
porter protein, resulting in altered function. It is well accepted that
prolonged treatment [44]. Diagnosis of ASA poisoning usually in-
membrane fluidity affects various functions of the membrane
volves measurements of plasma salicylate, the active metabolite
including transport, accessibility of receptors and enzyme activity
of ASA. Plasma ASA levels in general range from 30 to 100 mg/L
[37]. Hitherto, changes in membrane fluidity have been shown to
alter the facilitated sodium-dependent renal transport of phos-
50–300 mg/L (0.3–1.7 mM) in patients taking high doses, and
phate and glucose [37–38], p-glycoprotein-mediated transport of
700–1400 mg/L (3.9–7.8 mM) following acute overdose [45]. It is
organic cations [39] and glycerol permeability [40]. Nevertheless,
important to emphasize that the effects of ASA detected in the
the phenomenon of lipid–protein interactions is still poorly under-
present work, particularly at the erythrocyte membrane level, were
stood and further research is needed to elucidate the correlation
observed at a concentration as low as 40 lM, which is significantly
M. Suwalsky et al. / Archives of Biochemistry and Biophysics 539 (2013) 9–19
lower than the plasma therapeutic concentration. Considering the
mechanism of salicylate action, worth mentioning are studies ofRosenkranz et al. [46], who demonstrated that administration of
[1] P.A. Mackowiak, A. Philip, Clin. Infect. Dis. 31 (2000) 154–156.
[2] J.R. Vane, R.M. Botting, Thromb. Res. 110 (2003) 255–258.
salicylate in a pharmacologically effective dosage in man did not
[3] S. Oberle, T. Polte, A. Abate, H.P. Podhaisky, H. Schröder, Circ. Res. 82 (1998)
interfere with the antiplatelet effect of acetylsalicylic acid. Further-
more, SA had no discernible effect on cyclooxygenase in striking
[4] A. Burke, E. Smyth, G.A. FitzGerald, in: L.L. Brunton (Ed.), Goodman & Gilman's.
contrast to other drug of NSAID class such as ASA. Strikingly, this
The Pharmacological Basis of Therapeutics, 11th ed., McGraw-Hill, USA, 2006(Chapter 26).
might suggest that therapeutic effects of salicylate may not neces-
[5] Y. Zhou, R.M. Raphael, Biophys. J. 89 (2005) 1789–1801.
sarily be mediated by inhibition of prostaglandin synthesis.
[6] J.Y. Chen, W.H. Huestis, Biochim. Biophys. Acta 1323 (1997) 299–309.
In conclusion, data presented in this paper indicate that both
[7] J.M. Boon, B.D. Smith, Med. Res. Rev. 22 (2000) 251–281.
[8] P.F. Devaux, A. Zachowsky, Chem. Phys. Lipids 73 (1994) 107–120.
acetylsalicylic and salicylic acids interact with the human eryth-
[9] M. Suwalsky, M. Manrique, F. Villena, C.P. Sotomayor, Biophys. Chem. 141
rocyte membrane and their molecular models perturbing their
(2009) 34–40.
bilayer structures to various extents. However, results reported
[10] M. Manrique-Moreno, M. Suwalsky, F. Villena, P. Garidel, Biophys. Chem. 147
(2010) 53–58.
in the literature somewhat differ from ours. In fact, Watala and
[11] S. Etcheverry, M.J. Gallardo, P. Solano, M. Suwalsky, O.N. Mesquita, J. Biomed.
Gwozdzinski [25] investigated by means of fluorescence quench-
Opt. 17 (2012) 1060131–1060136.
ing and ESR spectroscopy the modifications induced by ASA and
[12] M. Manrique-Moreno, F. Villena, C.P. Sotomayor, A.M. Edwards, Biochim.
Biophys. Acta 2011 (1808) 2656–2664.
salicylate on erythrocyte ghosts. As they reported, only ASA was
[13] M. Suwalsky, J. Braz. Chem. Soc. 22 (2011) 2243–2249.
found to induce disorder in the lipid–protein matrix and mem-
[14] T. Parasassi, E. Gratton, J. Fluoresc. 5 (1995) 59–69.
brane protein conformation. They concluded that ASA-induced
[15] J.T. Dodge, C. Mitchell, C.D. Hanahan, Arch. Biochem. Biophys. 100 (1963) 119–
alteration in membrane protein structure induce a reorganization
[16] J.R. Lakowicz, Principles of Fluorescence Spectroscopy, Plenum, New York,
of lipid assembly as well as rearrangements in the membrane
protein pattern, and consequently alterations in lipid-protein
[17] T. Parasassi, G. Destasio, A. D'Ubaldo, E. Gratton, Biophys. J. 57 (1990) 1179–
interactions. On the other hand, Li et al. [26] found by means
[18] G. Mesquita, U. Agero, O.N. Mesquita, Appl. Phys. Lett. 88 (2006) 133901–
of photometric methods that sodium salicylate induced echino-
cytes to red cells, but in contrast their shapes were not affected
[19] M. Suwalsky, in: J.C. Salamone (Ed.), Polymeric Materials Encyclopedia, vol. 7,
by ASA. Although we have no explanation for these discrepan-
CRC, Boca Raton FL, 1996, pp. 5073–5078.
[20] D. Marsh, Biochim. Biophys. Acta 1062 (1991) 1–6.
cies, they possibly might be due to differences in experimental
[21] C. Huang, S. Li, Biochim. Biophys. Acta 1422 (1999) 273–307.
[22] R. Koynova, M. Caffrey, Biochim. Biophys. Acta 1376 (1998) 91–145.
Our experimental findings are certainly of interest since they
[23] N.A.H. Lewis, R.N. McElhaney, Biophys. J. 64 (1993) 1081–1096.
[24] D.L. Mazorow, A. Haug, R. Bull, E. McGroarty, Thromb. Res. 40 (1985) 779–792.
indicate that the highly consumed ASA in the pharmaceutical form
[25] C. Watala, K. Gwozdzinski, Biochem. Pharmacol. 45 (1993) 1343–1349.
of aspirin affects the human erythrocyte shape. It must be consid-
[26] A. Li, H. Seipelt, C. Müller, Y. Shi, M. Artmann, Pharmacol. Toxicol. 85 (1999)
ered that an alteration of the normal biconcave shape of red blood
[27] Y.Y. Bilto, Clin. Hemorheol. 20 (1999) 159–165.
cells increases their resistance to entry into capillaries [47], which
[28] M.A. Barret, S. Zheng, G. Roshankar, R.J. Alsop, R.K. Belanger, C. Huynh, N.
could contribute to decreased blood flow, loss of oxygen, and tissue
Kucerka, M.C. Rheinstädter, PLoS One 7 (2012) e34357.
damage through microvascular occlusion [48]. Since lipid bilayer is
[29] G.V. Betageri, J.A. Rogers, Int. J. Pharm. 46 (1988) 95–102.
[30] ChemIDplus Advanced, United States National Library of Medicine, <http://
the major permeability barrier of the membrane, the structural
perturbation induced by ASA will affect it. It might also affect the
[31] J.N. Sachs, T.B. Woolf, J. Am. Chem. Soc. 125 (2003) 8742–8743.
functions of ion channels, receptors and enzymes immersed in
[32] R.N.A.H. Lewis, R.N. McElhaney, in: P.L. Yeagle (Ed.), The Structure of Biological
the membrane lipid moiety. Accordingly to Lee [49], integral mem-
Membranes, CRC Press, 2012, pp. 19–91.
[33] H. Khandelia, S. Witzke, O.G. Mouritsen, Biophys. J. 99 (2010) 3887–3894.
brane proteins are not rigid entities around which the lipid bilayer
[34] U.R. Rao, C. Manohar, B.S. Valaulikar, R.M. Iyer, J. Phys. Chem. 91 (1987) 3286–
distorts enough as to provide the strongest interactions. Rather,
both lipid and proteins will distort to provide the best interactions
[35] S.V. Balasubramanian, R.M. Straubinger, M.E. Morris, J. Pharm. Sci. 86 (1997)
with the result that protein function will be affected by the struc-
[36] J.O. Wieth, J. Physiol. 207 (1970) 581–609.
ture of the surrounding lipid bilayer. These findings may provide a
[37] C. Le Grimellec, G. Friedlander, E.H.E. Yandouzi, P. Zlatkine, M.C. Giocondi,
new insight into the possible mechanism for the toxicity of ASA at
Kidney Int. 42 (1992) 825–836.
[38] B. Carriere, C. Le Grimellec, Biochim. Biophys. Acta 857 (1986) 131–138.
the level of the erythrocyte membranes.
[39] F.A. Sinicrope, P.K. Dudeja, B.M. Bissonnette, A.R. Safa, T.A. Brasitus, J. Biol.
Chem. 267 (1992) 24995–25002.
[40] R.A. Demel, B. de Kruijff, Biochim. Biophys. Acta 457 (1976) 109–132.
[41] L. Panicker, K.P. Mishra, J. Colloid Interface Sci. 290 (2005) 250–258.
[42] M.P. Sheetz, S.J. Singer, Proc. Natl. Acad. Sci. USA 71 (1974) 4457–4461.
To Drs. P. Sotomayor and L.F. Aguilar for their technical assis-
[43] G. Lim, M. Wortis, R. Mukhopadhyay, Proc. Natl. Acad. Sci. USA 99 (2002)
tance in the fluorescence experiments at the Institute of Chemistry,
[44] G. Levy, T. Tsuchiya, N. Engl. J. Med. 287 (1972) 430–432.
Catholic University of Valparaíso. This work was supported by
[45] P. Morris, W.R. Bartle, S.E. Walker, S.N. Lee, S.K. Bowles, R.A. Reeves, Ann.
FONDECYT (Grant 1130043). DSC measurements were carried out
Pharmacother. 30 (1996) 935–940.
with equipment purchased thanks to the financial support of the
[46] B. Rosenkranz, C. Fischer, C.O. Meese, J.C. Frölich, Br. J. Clin. Pharmacol. 21
(1986) 309–317.
European Regional Development Fund within the framework of
[47] S.L. Winski, D.E. Carter, J. Toxicol. Environ. Health A 53 (1998) 345–355.
the Polish Innovation Economy Operational Program (contract
[48] S. Svetina, D. Kuzman, R.E. Waugh, P. Zibert, B. Zeks, Bioelectrochemistry 62
No. POIG.02.01.00-12-167/08, project Malopolska Center of
(2004) 107–113.
[49] A.G. Lee, Biochim. Biophys. Acta 1666 (2004) 62–87.
Source: http://downloadketab.net/download/201/27.pdf
Zusammenfassung.2 Zuständige Ressorts / Betroffene Amtsstellen .2 Bericht der Regierung . 3 1. Ausgangslage. 3 1.1 Allgemeines. 3 1.2 Situation in Liechtenstein. 5 1.3 Welt-Anti-Doping-Agentur Zusatzprotokolls . 8 2.1 Die wichtigsten Merkmale des Übereinkommens . 8 2.2 Hauptziele Zusatzprotokolls . 9 3. Erläuterungen Zusatzprotokoll . 10 4. Verfassungsmässigkeit . 14
SESSION D: TRANSPORT AND COMMUNICATION. LA ORDENACIÓN DE LOS ESPACIOS PORTUARIOS Y LOS EFECTOS BARRERA PUERTO-CIUDAD. BERNARDO SÁNCHEZ PAVÓN Instituto Gallego de Estudios del Transporte y las Infraestructuras. Miembro de la Asociación Española de Ciencia Regional y de la European Regional Science