Doi:10.1016/j.biocel.2006.05.013
The International Journal of Biochemistry & Cell Biology 38 (2006) 1975–1985
Co-expression of chaperonin GroEL/GroES enhances in vivo folding
of yeast mitochondrial aconitase and alters the growth
characteristics of
Escherichia coli
Parul Gupta, Nishtha Aggarwal, Pragya Batra,
Saroj Mishra, Tapan K. Chaudhuri
Department of Biochemical Engineering and Biotechnology, Indian Institute of Technology, Delhi,
Hauz Khas, New Delhi 110016, India
Received 24 January 2006; received in revised form 19 May 2006; accepted 23 May 2006
Available online 2 June 2006
Over last two decades many researchers have demonstrated the mechanisms of how the
Escherichia coli chaperonin GroEL
and GroES work in the binding and folding of different aggregation prone substrate proteins both in vivo and in vitro. However,preliminary aspects, such as influence of co-expressing GroEL and GroES on the over expression of other recombinant proteins in
E. coli cells and subsequent growth aspects, as well as the conditions for optimum production of recombinant proteins in presence ofrecombinant chaperones have not been properly investigated. In the present study we have demonstrated the temperature dependentgrowth characteristics of
E. coli cells, which are over expressing recombinant aconitase and how the co-expression of
E. colichaperonin GroEL and GroES influence the growth rate of the cells and in vivo folding of recombinant aconitase. Presence of co-expressed GroEL reduces the aconitase over-expression drastically; however, exogenous GroEL & GroES together compensate thisreduction. For the aconitase over-expressing cells the growth rate decreases by 30% at 25 ◦C when compared with the M15
E. colicells, however, there is an increase of 20% at 37 ◦C indicating the participation of endogenous chaperonin in the folding of a fractionof over expressed aconitase. However, in presence of co-expressed GroEL and GroES the growth rate of aconitase producing cellswas enhanced by 30% at 37 ◦C confirming the assistance of exogenous chaperone system for the folding of recombinant aconitase.
Optimum in vivo folding of aconitase requires co-production of complete
E. coli chaperonin machinery GroEL and GroES together.
2006 Elsevier Ltd. All rights reserved.
Keywords: Over expression of recombinant aconitase; In vivo protein folding;
Escherichia coli growth profile; Bacterial chaperonin GroEL andGroES
AMPR, ampicillin resistance; LB, luria broth;
The production of recombinant protein in
Escherichia
APS, ammonium persulfate; DTT, 1,4-dithiothreitol; HEPES, 4-2-
coli is one of the major efforts in biotechnology today. A
hydroxyethyl-1-piperazineethanesulfonic acid; IPTG, isopropyl -d-
major limitation in the over expression of recombinant
thiogalactoside; SDS-PAGE, sodium dodocyl sulfate-polyacrylamide
proteins is the inability of many recombinant polypep-
gel electrophoresis
tides to fold into their biologically active conformations
Corresponding author. Tel.: +91 11 2659 1012;
fax: +91 11 2658 2282.
within the milieu of the bacterial cell. The question of
E-mail address: (T.K. Chaudhuri).
protein folding has been a subject of intensive research
1357-2725/$ – see front matter 2006 Elsevier Ltd. All rights reserved.
P. Gupta et al. / The International Journal of Biochemistry & Cell Biology 38 (2006) 1975–1985
since wed that a denatured pro-
of interest is a common method, making their down-
tein could fold unassisted under in vitro conditions. In
stream processing much easier. The main purpose of
vivo protein folding is a different phenomenon, com-
recombinant protein expression is often to obtain an
plicated by macromolecular crowding in cytosol. The
accumulation of high degree of soluble product in the
mechanism of in vivo protein folding remains one of the
bacterial cell. This strategy is not always accepted by
most intriguing problems to be elucidated in molecu-
the metabolic system of the host and in some situations
lar biology The in vivo folding
a cellular stress response is encountered
pathways are affected by a number of factors, such as
physico-chemical conditions of the cellular environment
In the last decade, extensive amount of work has
and transient interactions with other co translated pro-
been done on the co-over expression of the GroEL/ES
teins, not present in the simplified in vitro assays. In the
in
E. coli along with other foreign proteins. The co-over
complex medium of the cell, the physical conditions of
expression of the bacterial chaperone system GroEL/ES
temperature, pH, etc., are restricted, and the concentra-
along with several proteins like -crystallin (
tion of macromolecules is high creating a dynamically
malate dehydrogenase
changing environment for newly synthesized proteins
medium-chain acyl-CoA dehydrogenase
(Molecular chaperones are a
(MCAD) (carbamoylase
class of proteins thought to facilitate protein folding in
and aconitase sig-
this environment (
nificantly enhance the yield of soluble protein. The
effect of GroEL/ES on protein folding in association
these helper proteins in the last decade has extended the
with other chaperones like trigger factor
field of in vivo protein folding enormously. As unfolded
polypeptide contains many more exposed hydrophobic
has also been studied. It
residues than the polypeptide in its native state, they
has been found that the over expression of GroEL/ES
are much more susceptible to aggregation. Whether the
restores appropriate protein folding in the cells where
polypeptide is a nascent chain on a ribosome or a mature
trigger factor and DnaK have been deactivated. Exten-
protein recently unfolded due to stress, suppression of
sive work on the mechanistic aspects of protein folding
aggregation is essential in order to maintain proteins
in presence of chaperonin has also revealed valuable
in a state competent for folding. Molecular chaperones
information on protein folding pathway and aggregation
are large family of proteins found in all types of organ-
isms and have a very important role in protein folding
and maintaining protein homeostasis (
studies on the effect of co-expressing chaperonin in the
Chaperone families are highly conserved across
cell along with other proteins and their implications on
genomes, suggesting that their functions are essential for
the cell growth have not been thoroughly investigated.
cellular life (Chaperones are thought
Parameters like optimum temperature, inducer concen-
to prevent newly synthesized proteins from misfold-
tration, duration of induction, etc., play an important
ing and aggregating, impeding undesired hydrophobic
role in enhancing the level of production of the desired
interactions, and allowing alternative folding pathways
protein in its native form. Here we have studied differ-
(They bind to the exposed hydrophobic
ent aspects of cell growth parameters during the over
regions of nonnative proteins, hindering aggregation
production of recombinant aconitase in presence and
(Therefore, through regu-
absence of over producing exogenous molecular chaper-
lated cycles of peptide binding and release, chaperones
onin, GroEL and GroES. Our main aim is to understand
facilitate the acquisition of the active conformation of
the conditions for optimum production of recombinant
the polypeptides. The most extensively studied chaper-
aconitase in the presence and absence of co-expressed
ones are the chaperonin – GroEL and GroES – from
chaperonin GroEL and GroES in
E. coli and subsequent
E. coli (The atomic struc-
growth profiles and their temperature dependence.
ture of GroEL and GroES (are known and also that of the GroEL–GroES
2. Materials and methods
complex formed in the presence of ADP Over expression of the molecular chaperones in
E. coli
2.1. Chemicals and reagents
Luria broth (LB) for
E. coli growth and antibiotics
for obtaining large quantities of correctly folded protein
kanamycin, ampicillin and tetracyclin were obtained
P. Gupta et al. / The International Journal of Biochemistry & Cell Biology 38 (2006) 1975–1985
from HiMedia (India). 4-2-hydroxyethyl-1-piperazi-
Expression was checked by running various sam-
ples on 15% SDS-PAGE (
(DTT), acrylamide, bis-acrylamide, standard molecular
To study the effect of temperature on
weight markers, ammonium persulfate (APS) and
the specific growth rate, the experiment was carried out
isopropyl -d-thiogalactoside (IPTG) were obtained
at two different temperatures (25 ◦C and 37 ◦C). Effect
from Bangalore, Genei (India). Other reagents and
of induction on the growth rate of various strains was
chemicals used were from Merck (Germany) and Sigma
observed from the growth curve generated with and with-
out induction.
2.2. Strains and plasmids
2.4. Determination of the specific growth rateconstants for bacterial growth
The gene for yeast mitochondrial aconitase, cloned
in the pQE60 vector from Qiagen (AMPR selectable
The specific growth rate constants for various growth
marker) with ColE1 origin of replication was obtained
profiles was calculated by plotting absorbance versus
from Dr. Sabine Rospert, Germany. The constructs
time and obtaining the slope by exponential trend using
pACYCEL over expressing GroEL and pACYCELS
the following equation:
over expressing GroEL and GroES (with tetracycline
X =
X
resistance) are generous gift from Dr. Arthur L. Horwich,
USA. M15
E. coli strain, K12 derivative was used for the
where
X = biomass at time ‘
t';
X0 = biomass at time
expression of various plasmids. M15 strain, containing
‘
t = 0';
µ = specific growth rate constant;
t = time in
multiple copies of pREP4 plasmid, was maintained in
presence of kanamycin. pREP4 plasmid carries the
lacIgene encoding the lac repressor and hence the expres-
2.5. Estimation of the relative intensities of the
sion of aconitase in pQE60 is regulated. M15 cells were
bands in the SDS gel
transformed with plasmid pAco to express only aconi-tase, with pAco and pACYCEL to express aconitase and
BioRad (USA) gel documentation unit was used for
GroEL, with pACYCELS to express GroE-GroES and
estimating the relative quantities of the various protein
with pAco and pACYCELS to express aconitase, GroEL
bands observed on the gel. Gel image was taken and the
and GroES. The antibiotic concentration used for the
various lanes were framed using ‘manual frame lanes'
optimum growth of the cells was 25 g/ml, 80 g/ml and
toolbar. The number of lanes in the frame was kept the
12.5 g/ml for kanamycin, ampicillin and tetracycline,
same as that present in the gel. The lanes drawn were
adjusted to fit the size of the lanes in the gel. Lane
E. coli M15 strain was activated from a stab cul-
background subtraction was carried out to remove the
ture by streaking on luria agar plate supplemented with
background intensity of the gel itself from the bands.
required amount of antibiotics. Ten milliliters LB sup-
‘Band analysis quick guide' from the Quantity one pro-
plemented with antibiotics was inoculated and cultured
gram (BioRad) was used to select the bands. Bands were
at 37 ◦C. This strain was further maintained by mak-
detected using ‘band detect' option and the area of the
ing 20% glycerol stocks, frozen in liquid nitrogen and
band with the required peak was adjusted using ‘adjust
stored at −80 ◦C. These stocks were used subsequently
band' option to get the region of the band to be estimated.
for making competent cells and transformation with var-
Relative quantity of the band selected was measured by
ious plasmids. Various transformed recombinant
E. coli
selecting ‘relative quantity' from ‘band attributes' tool-
cells were also grown and maintained as described above.
bar. Relative quantity of a particular band is the quantitymeasured by its intensity, expressed as a percentage of
2.3. Determination of growth profile
the total intensity of all the bands in the lane.
Various
E. coli strains were grown at 25 ◦C and
2.6. IPTG titration
37 ◦C, at 200 rpm in shake flasks and 1 ml of cell sus-pension was withdrawn at various time intervals for
Various
E. coli strains transformed with recombinant
turbidity measurements at 650 nm using UVIKON 930
plasmids were grown in LB medium supplemented with
spectrophotometer (Kontron instruments, USA). Induc-
antibiotics upto OD650 between 0.6 and 1.0. At this point
tion was done at OD650 of 0.7–1.0 with 100 M IPTG
each culture was divided into nine parts of 10 ml each.
for expression of aconitase (
IPTG was added at nine different concentrations ranging
P. Gupta et al. / The International Journal of Biochemistry & Cell Biology 38 (2006) 1975–1985
from 0 M to 200 M
The assay was performed by taking 20–50 g of
The cultures were left overnight at 37 ◦C and the level
protein in a 1 ml reaction volume (0.1 M Tris–HCl pH
of expression were analyzed by 15% SDS-PAGE.
8, 0.66 mM sodium citrate, 0.66 mM MnSO4, 0.5 mg/ml
-NADP and 0.17 mg/ml isocitrate dehydrogenase). The
2.7. In vivo folding of aconitase
formation of NADPH was monitored at 340 nm usingtime/kinetics application on Beckman Coulter DU 800
Amount of folded protein in a cell can be estimated
based on the principle that the proteins with a three-dimensional structure are soluble in the cytoplasm and
3. Results
in aqueous buffer, however, denatured proteins are insol-uble and occur as aggregates
3.1. Changes in growth profile of E. coli cells on
Thus, to estimate the extent of correct folding of aconi-
transformation with various recombinant plasmids
tase in vivo, the induced cells were pelleted and brokendown by sonication to release the intracellular compo-
E. coli is used extensively for the expression and over
nents in the lysis buffer. Normalization of the cell culture
production of both prokaryotic and eukaryotic recom-
was done, such that same number of cells were taken for
binant proteins, as it requires very simple growth con-
the analysis of each sample. The soluble components
ditions. The growth profile of
E. coli changes consider-
were separated from the insoluble mass by centrifuga-
ably depending on the type and number of recombinant
tion of the cell lysate. The supernatant and the pellet
plasmid it contains and the number of proteins it over
were analyzed separately for the presence of aconitase by
expresses. Bacterial cell growth was monitored by mea-
SDS-PAGE and enzymatic activity test. Culture broths of
suring turbidity of the cell culture at 650 nm using a
different transformed strains expressing aconitase at dif-
ferent temperatures were harvested and resuspended inlysis buffer containing 50 mM HEPES (pH 7.4), 0.5 mM
3.1.1. Effect of plasmid characteristics on the
MgCl2, 1 mM DTT (These cells
growth rate of transformed cells
were disrupted using ultrasonicator, followed by cen-
The growth curve for various transformed strains of
E.
trifugation at 10,000 rpm for 45 min. The supernatant and
coli namely, M15 cells expressing aconitase, M15 cells
pellet were separated and freeze dried in a lyophillizer
expressing aconitase and GroEL, M15 cells expressing
(LABCONCO freezedry 4.5). Lyophilized supernatant
aconitase, GroEL and GroES and M15 cells expressing
and pellet were resuspended in the loading buffer and
GroEL and GroES were generated by plotting turbid-
analyzed by SDS-PAGE. Aconitase activity assay was
ity values at 650 nm of various strains against growth
done taking 50 g of total protein in each case.
time without induction. M15 strain was used as a neg-ative control in all these studies. The growth profiles of
2.8. Aconitase assay
transformed cells without induction showed the effectof plasmid replication and maintenance on the rate of
Aconitase activity was quantitated using a coupled
growth At both the temperatures (25 ◦C and
enzyme assay. Aconitase catalyses conversion of cit-
37 ◦C), cells containing pACYCEL plasmid showed a
rate to isocitrate, which in turn is converted to ␣-keto
decrease of more than 25% in the growth rate. At 25 ◦C,
glutarate in presence of isocitrate dehydrogenase along
presence of pACYCELS plasmid in M15 cells reduced
with the formation of NADPH from NADP
the growth rate by about 40% as compared to M15 wild
Table 1Specific growth rate constants (
µ) for the growth of M15
E. coli strain under various plasmid-containing situations at 25 ◦C and 37 ◦C
E. coli strain
µ at 25 ◦C
µ at 37 ◦C
Uninduced strains
Uninduced strains
M15 + Aco + GroEL
M15 + GroEL + GroES
M15 + Aco + GroEL + GroES
Regression coefficient values are given in brackets.
P. Gupta et al. / The International Journal of Biochemistry & Cell Biology 38 (2006) 1975–1985
type cells, whereas, at 37 ◦C, presence of pACYCELS
presence of pREP4 plasmid in the M15 E. coli strain pro-
plasmid showed an increase in growth rate by about 10%
vides the lacI gene from the Lac operon, which represses
No appreciable change in the growth pro-
the aconitase expression in pQE60. Addition of inducer
file was observed for M15 cells on transformation with
to the cell culture medium activates the expression of the
aconitase plasmid (
aconitase. A kinetics analysis, after addition of IPTG,was done to estimate the duration of induction required
3.1.2. Effect of IPTG induction on the growth
for the expression of aconitase in presence and absence of
profile of various transformed strains at different
chaperonin at 25 ◦C and 37 ◦C. The expression of aconi-
tase was estimated by SDS-PAGE analysis of samples
Growth profiles of all the M15 strains transformed
withdrawn at different time intervals (Figs. It
with pAco, pAco-pGroEL, pGroELS, and pAco-
was found that at 37 ◦C, aconitase expression in absence
pGroELS were studied with and without IPTG induction.
of chaperonin requires 5 h of incubation after induction
Induction was carried out with 100 M IPTG in the tur-
In presence of only GroEL it requires the least
bidity range (OD650) of 0.6 to 1.0. At 25 ◦C, all aconitase
time of 2 h for induction, whereas, when both GroEL and
over expressing M15 strains, with and without recombi-nant GroEL/ES showed a reduction in the growth rate,the most notable however, are the M15 cells harboringonly aconitase, which showed a 30% reduction in growthrate At 37 ◦C, a complete reversal in the growthprofile was observed. Aconitase over expressing M15strains, showed an overall rise in growth rate after induc-tion. Only aconitase over expressing strain showed a riseof 20% when compared with wild type M15 cells and20% increase in growth rate was observed for aconitaseand GroEL over expressing strain (A signifi-cant rise of 30% was observed in the specific growth rateof M15 cells expressing aconitase in presence of bothGroEL and GroES. The changes in specific growth rateof various cultures on induction are unavoidable, how-ever, such changes can be minimized by redesigning andengineering various pathways
3.1.3. Effect of temperature on the growth profile ofvarious transformed strains after induction withIPTG
Growth profiles of different transformed M15 cells
containing pAco, pAco + pGroEL, pAco + pGroELS andpGroELS plasmids were studied at two different tem-peratures, 37 ◦C and 25 ◦C, after induction with IPTG.
At 37 ◦C, the growth rate for all transformed cells was
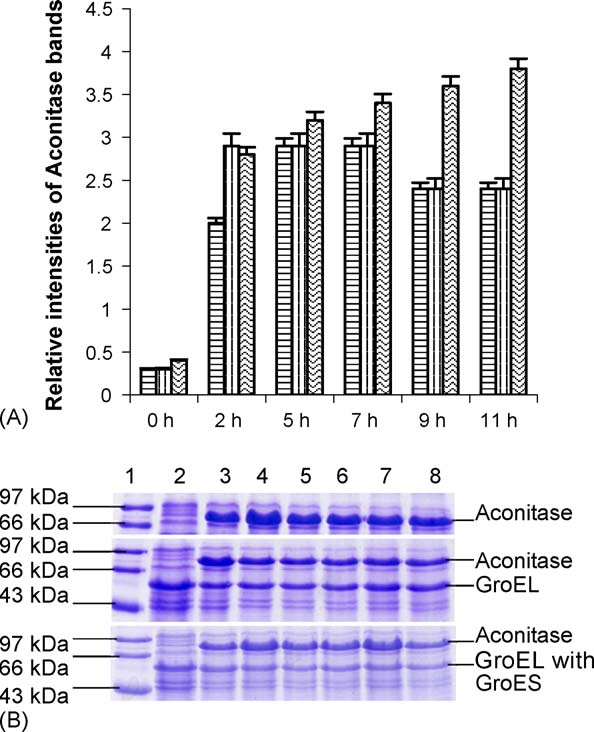
Fig. 1. (A) Relative expression of aconitase with time in the presenceand absence of GroEL/ES at 37 ◦C. The graph shows the different
found to be about two times higher than those at 25 ◦C for
relative intensities of the aconitase bands in the gel depicting the lev-
the same strain. Other changes in the trends for various
els of expression of aconitase in presence and absence of GroEL and
growth parameters for different transformed cells have
GroEL/ES at 37 ◦C with different durations of incubations. The first
been observed by changing temperature (as discussed in
bar of the triad shows only aconitase expression, the second bar of
the above result Sections
the triad shows aconitase expression in presence of only GroEL andthe third bar of the triad shows aconitase expression in presence ofboth GroEL and GroES. (B) 15% SDS-PAGE shows level of aconitase
3.1.4. Over expression of aconitase in M15 cells
expression in presence and absence of GroEL and GroEL/ES at 37 ◦C
with time of induction in the absence and presence
with different durations of incubations. Lane 2, 0 h; lane 3, 2 h; lane
of over expressing chaperonin GroEL/ES
4, 5 h; lane 5, 7 h; lane 6, 9 h; lane 7, 11 h and lane 8, 15 h. Lane 1
The gene for yeast mitochondrial aconitase (pAco) is
shows medium range standard molecular markers. Top panel showsover expression of aconitase only, center pane shows aconitase over
cloned in pQE60 vector, which confers ampicillin resis-
expression in presence of GroEL and bottom panel shows aconitase
tance to the cells and has ColE1 origin of replication. The
over expression of aconitase in presence of GroEL and GroES.
P. Gupta et al. / The International Journal of Biochemistry & Cell Biology 38 (2006) 1975–1985
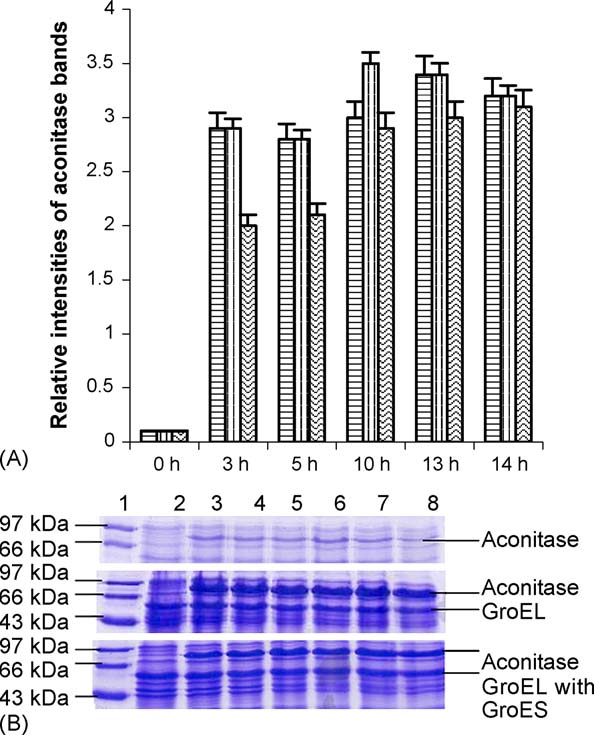
Fig. 2. (A) Relative expression of aconitase with time in the presence
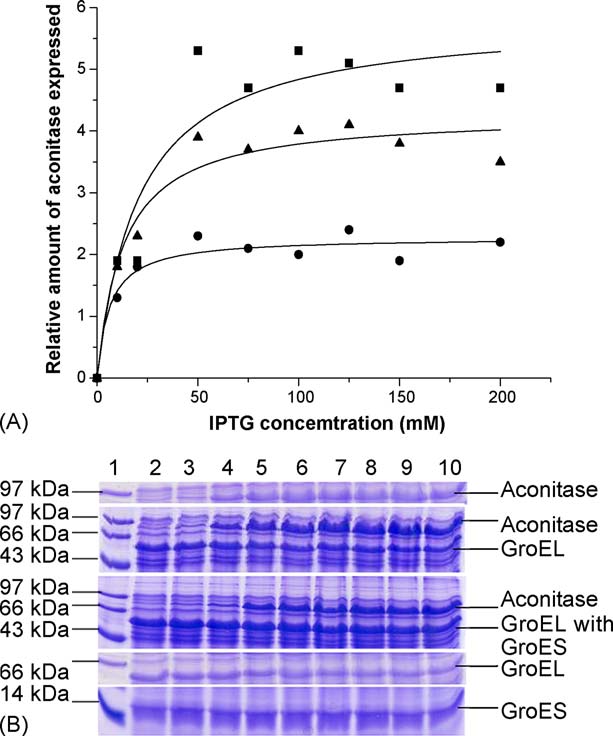
Fig. 3. (A) Optimization of IPTG concentration for aconitase expres-
and absence of GroEL/ES at 25 ◦C. The graph shows the different
sion. Variation of expressed aconitase with change in inducer con-
relative intensities of the aconitase bands in the gel depicting the lev-
centration. Solid squares show M15 cells expressing aconitase only,
els of expression of aconitase in presence and absence of GroEL and
solid triangles show M15 cells expressing aconitase and GroEL, solid
GroEL/ES at 25 ◦C with different durations of incubations. The first
circles show M15 cells expressing aconitase, GroEL/GroES. Opti-
bar of the triad shows only aconitase expression, the second bar of
mum IPTG required for induction of aconitase is 75 M (Origin 5.0
the triad shows aconitase expression in presence of only GroEL and
software was used to fit the graph). (B) 15% SDS-PAGE showing
the third bar of the triad shows aconitase expression in presence of
variation of expressed aconitase with change in IPTG concentration.
both GroEL and GroES. (B) 15% SDS-PAGE shows level of aconitase
Lane 1, standard protein molecular weight markers. Lane 2, 0 M
expression in presence and absence of GroEL and GroEL/ES at 25 ◦C
IPTG. Lane 3, 10 M IPTG. Lane 4, 20 M IPTG. Lane 5, 50 M
with different durations of incubations. Lane 2, 0 h; lane 3, 3 h; lane
IPTG. Lane 6, 75 M IPTG. Lane 7, 100 M IPTG. Lane 8, 125 M
4, 5 h; lane 5, 10 h; lane 6, 13 h; lane 7, 14 h and lane 8, 17 h. Lane
IPTG. Lane 9, 150 M IPTG. Lane 10, 200 M IPTG. Top panel
1 shows medium range standard molecular markers. Top panel shows
shows induced aconitase in absence of chaperonin, second panel shows
over expression of aconitase only, center pane shows aconitase over
induced aconitase expression in presence of GroEL, third panel shows
expression in presence of GroEL and bottom panel shows aconitase
induced aconitase expression in presence of GroEL and GroES and
over expression of aconitase in presence of GroEL and GroES.
bottom panel shows constitutive expression of GroEL and GroES incells expressing no aconitase.
GroES are present, expression of recombinant aconitase
for 24 h. No over expressed protein was found in M15
requires much longer induction period of 11 h. At 25 ◦C,
cells on IPTG induction. GroEL and GroES were found
expression of aconitase requires 13 h of incubation after
to be over expressed constitutively and did not require
induction in absence of chaperonin (). M15 cells
any inducer for complete expression Recom-
expressing aconitase and GroEL requires 10 h and aconi-
binant aconitase expression was found to be inducible by
tase expression in presence of both chaperonin requires
IPTG. M15 cells expressing pAco gene in the absence
14 h of incubation after induction.
and presence of chaperonin was found to require 75 MIPTG for optimum expression of aconitase
3.1.5. Inducer concentration required for optimumexpression of recombinant aconitase
3.2. Over expression of aconitase in E. coli M15
M15 cells transformed with pAco in presence and
cells in presence and absence pGroEL/pGroELS
absence of pGroEL/pGroELS were induced with dif-ferent concentration of IPTG, when the turbidity of the
E. coli M15 strain containing pREP4 plasmid was
culture at 650 nm reached to 0.9 and were left at 37 ◦C
transformed with high copy number plasmid (pAco) con-
P. Gupta et al. / The International Journal of Biochemistry & Cell Biology 38 (2006) 1975–1985
Table 2Expression level of aconitase in presence and absence of GroEL/ES at25 ◦C and 37 ◦C
Relative quantity of
Relative quantity of
aconitase at 25 ◦C
aconitase at 37 ◦C
Aconitase with GroEL
Aconitase with GroEL
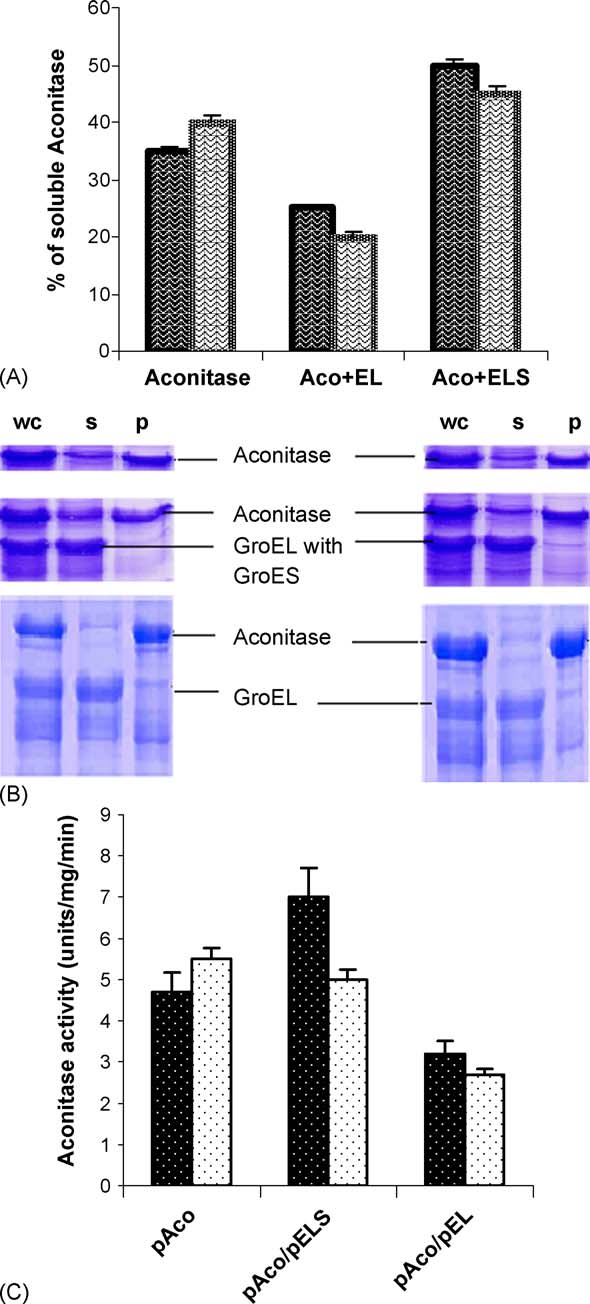
3.2.1. In vivo folding of aconitase in absence andpresence of co-expressed GroEL and GroES in E.
coli cells
Non-native aconitase lodges itself as insoluble aggre-
gates in a cell, which is deficient in chaperonins, ascompared to being fully soluble in a wild type cell pro-ducing both the chaperonin (Theextent of correctly folded native protein in a cell canbe determined based on the principle that, a folded pro-
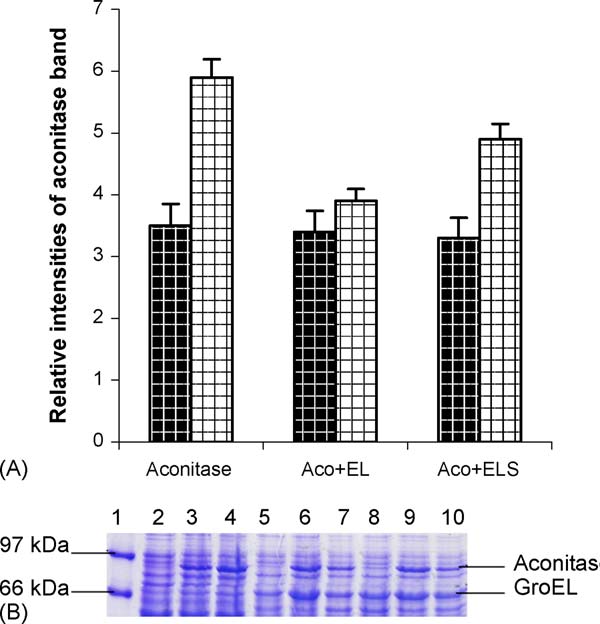
Fig. 4. (A) Expression levels of aconitase in the presence of GroEL and
teins would be soluble, whereas the denatured proteins
GroEL/ES. Graph shows changes in the level of expression of aconi-tase in recombinant M15 cells expressing aconitase in absence and
would form aggregates and stay insoluble. On cell dis-
presence of GroEL and GroES (relative band intensities of aconitase
ruption and fractionation, the supernatant contains the
have been compared in various cases). Bold check shows the varia-
soluble proteins and all the aggregated proteins along
tion at 25 ◦C and hollow check shows at 37 ◦C. (B) 15% SDS-PAGE
with cell debris form a pellet. SDS-PAGE analysis of
showing changes in the level of expression of aconitase in recombinant
the supernatant and pellet fraction of the cell lysate
M15 cells, expressing aconitase in absence and presence of GroEL andGroES. Standard molecular markers in lane 1 and lane 2 show unin-
showed that, in the absence of exogenous
duced aconitase, lane 3 and 4 show induced aconitase in duplicate,
GroEL and GroES, ∼35% of the over expressed aconi-
lane 5 show uninduced aconitase in presence of GroEL, lane 6 and
tase was found in the soluble form in the supernatant at
lane 7 show induced aconitase in presence of GroEL and lane 8 shows
25 ◦C which increased to ∼40% at 37 ◦C. In
uninduced aconitase in presence of GroEL and GroES, lane 9 and lane
presence of chaperonin GroEL, only 25% of the over
10 show induced aconitase in presence of GroEL and GroES.
expressed aconitase showed up as folded fraction inSDS-PAGE at 25 ◦C, whereas 20% of the over expressed
taining the gene for the yeast mitochondrial aconitase
aconitase appeared to be folded at 37 ◦C. When both
with a Lac-regulated promoter. A distinct band in SDS-
the chaperonin GroEL and GroES were present approxi-
PAGE observed in the transformed strain clearly showed
mately 50% of expressed aconitase was soluble at 25 ◦C
the over expression of aconitase in the strain
and about 40% at 37 ◦C Aconitase activity
E. coli M15 strain containing pACYCEL plasmid con-
data show that the soluble form of aconitase is
stitutively over expressing GroEL was transformed with
also biologically active. When pGroEL alone is present
pAco and the expression of aconitase showed a marked
in a cell, which is over expressing aconitase, aconitase
reduction of about 40% at 37 ◦C Whereas,
gets trapped in the hydrophobic cavity of GroEL; hence
when pAco is expressed in presence of pGroELS the
it neither folds nor gets released as a folding competent
reduction in aconitase expression is only 20%. The
intermediate. GroEL remains in the fully native form in
presence of the gene for a large 800-kDa protein in
the cell and hence appears in the supernatant. The pro-
pGroEL/pGroELS, directs most of the energy produced
teins that remain bound with GroEL will appear in the
by metabolism in the cell for over production of GroEL,
supernatant, even if they are not biologically active or
resulting in a reduced aconitase expression in the cell.
in a folded state. Thus, some GroEL bound non-native
Presence of both GroEL and GroES in the cell helps to
aconitase appears in the soluble form with GroEL alone
fold the over expressed aconitase correctly. At 25 ◦C,
when tested by SDS PAGE (The increase in the
almost no change in the expression in the aconitase is
amount of folded aconitase in presence of GroEL and
observed in presence of GroEL/GroES and
GroES clearly shows that presence of both GroEL and
GroES are required for the correct folding of aconitase.
P. Gupta et al. / The International Journal of Biochemistry & Cell Biology 38 (2006) 1975–1985
These observations are consistent with the earlier obser-vations by aconitase does notfold correctly on inactivation of the chaperonins in yeastmitochondria.
Cells derive energy for growth from metabolic activ-
ities. They use this energy to carry out essential func-tions like reproduction, growth, synthesis of various bio-molecules like proteins and nucleic acid, wear and tearmanagement, etc. When a cell is programmed to producelarge amount of one or more recombinant proteins, theinherent energetics of the cell growth gets disturbed. Theenhanced metabolic load exerted on the cell for main-tenance and expression of recombinant plasmid mayadversely affect the rate of growth of a cell produc-ing recombinant proteins as compared to the wild typestrain (Reduction in specific growth rates inpresence of a large number of plasmid in a recombinantcell is well known However, in our studywe found varying trends. Transformation of M15 E.
coli strain with pACYCEL/ES increases the growth ratesignificantly at 37 ◦C, whereas it decreases at 25 ◦C.
Higher temperature acts as an inducer for production ofheat shock proteins like GroEL and GroES. EnhancedGroEL/ES production at 37 ◦C helps the cells in pre-venting aggregation, which enhances the cell efficiencyand induces the correct folding of various proteins in thecells resulting in enhanced growth. At 25 ◦C, aggrega-tion of both native and recombinant proteins is much lessin comparison to 37 ◦C. Thus, at 25 ◦C, the advantageof over expressed GroEL and GroES becomes a liabilitywhere it has to spend a lot of energy for synthesis of large800 kDa GroEL (resulting inreduction of the growth rate in presence of chaperonin.
Only pAco containing cells seemed to have had a verylittle effect on the growth rates of uninduced cultures.
As M15 cells contain endogenous aconitase as well
Fig. 5. (A) In vivo folding of aconitase in the absence and presence of
as GroEL and GroES, hence, on transformation with
GroEL/ES. Graph shows the change in the level of folded aconitase in
pAco and pGroELS, the cells will produce recombinant
the presence and absence of GroEL and GroEL/ES at 25 ◦C and 37 ◦Cin vivo. Bold waves show folding at 25 ◦C and hollow waves shows
aconitase and chaperonin along with their endogenous
folding at 37 ◦C. (B) 15% SDS-PAGE shows the change in the level
counterpart. Enhanced production of heat shock proteins
of folded aconitase in vivo, in the presence and absence of GroEL and
at elevated temperatures in various organisms like E. coli
GroEL/ES at 25 ◦C and 37 ◦C. First column of gels depicts folding at
25 ◦C and the second column shows folding at 37 ◦C. Total amount ofaconitase (whole cell) in the first lane, folded aconitase (supernatant) isseen in the central lane and aggregated aconitase (pellet) is in the thirdlane. Amount of folded aconitase in presence of GroEL and GroES can
p, pellet). (C) Aconitase activity assay for over expressed aconitase
the seen the most distinctly in the central panel. Aconitase in absence
alone, with GroEL/ES and with GroEL alone are done and shown as
of any chaperonin is shown in the top panel and aconitase in presence
units per mg of protein per min. Black bars show activity at 25 ◦C and
of only GroEL is in lowest panel (wc, whole cell; s, supernatant;
white bars at 37 ◦C.
P. Gupta et al. / The International Journal of Biochemistry & Cell Biology 38 (2006) 1975–1985
parasites and brown
This reduces the rate of protein synthe-
are well documented. Endogenous chaperonin,
sis (another ATP driven reaction) significantly. At lower
being heat shock proteins are activated at higher tem-
temperature the protein synthesis itself is very slow,
peratures. Thus, on IPTG induction, all aconitase over
requiring larger time for complete induction to occur.
expressing strain shows an increase in the growth rate
For complete induction of the Lac–operon system a
at 37 ◦C. The endogenous chaperones present in E. coli
critical concentration of inducer is required to inactivate
produced at higher rates at 37 ◦C may help a fraction of
the repressor protein produced by lacI gene. Addition of
the over expressed aconitase to fold correctly, which in
IPTG binds to the active LacI repressor and causes dis-
turn enhances the TCA cycle and generates more energy
sociation from its operator. Use of IPTG as the inducer
resulting in enhanced growth rate. Infact, the enzymatic
for production of heterologous proteins has already been
activity test reveals higher aconitase activity in pAco
tested The optimum con-
containing cells at 37 ◦C Co-expression of
centration of inducer for aconitase expression was found
GroEL along with aconitase at 37 ◦C showed a similar
to be 75 M. At lower concentration of IPTG the amount
trend as that of only aconitase over expressing cells. A
of aconitase produced was much less. Thus, varying con-
major chunk of over expressed aconitase gets trapped
centrations of the inducer can be efficiently used as a
in GroEL cavity and in the
simple tool for controlling the expression of recombi-
absence of adequate GroES, it is unavailable for both
nant aconitase in E. coli.
folding by active endogenous chaperonin and aggrega-
Aconitase expression in E. coli seems to be affected
tion. Growth rate is maximum when the entire folding
by the over expression of GroEL and GroES. In pres-
machinery is present since: (a) larger amounts of both
ence of GroEL alone, the amount of over expressed
GroEL and GroES help in correct folding of various
aconitase reduces drastically. The reason may be that
proteins, enhancing cell efficiency by minimizing toxic
the cells are giving a priority to the synthesis and fold-
effects of protein aggregation, and (b) the extra energy
ing of the helper protein GroEL so that less energy is
required for the expression and synthesis of GroEL and
available for the synthesis of aconitase. In presence of
GroES and for folding is off set by enhanced genera-
both the chaperonin, the reduction in aconitase expres-
tion of ATP by active TCA cycle due do increased active
sion is almost negligible as the presence of the complete
aconitase. Above results are also substantiated by cal-
folding machinery increases the extent of correct folding
culation of GroEL: aconitase ratio using relative band
of newly synthesized aconitase. The excess ATP gener-
intensities by gel documentation. An increase of 25%
ated from enhanced TCA cycle through the participation
in the GroEL: aconitase ratio was observed at 37 ◦C as
of increased amount of correctly folded aconitase may
compared to that at 25 ◦C in the cells over expressing
serve two purposes: (a) enhancing cell growth rate and
aconitase and GroEL.
(b) increasing rate of protein synthesis. The increase in
Time of incubation required after induction to over
protein synthesis can be seen in the form of enhanced
expressed aconitase, for the pAco containing strain, in
aconitase expression in presence of both GroEL and
presence of chaperonin GroEL only, was found to be
the least. Whereas, in presence of the complete fold-
Reduced expression of aconitase in the E. coli cells
ing machinery viz. GroEL and GroES the time required
over producing GroEL also supports the observation that
was the maximum as compared to the over expression of
the least time of induction is required by cells over-
aconitase in absence of chaperonin. Earlier reports (
expressing aconitase and GroEL simultaneously. Due to
high expression of aconitase in strains expressing the
that aggregate formation in cell causes reduction in cell
entire chaperonin machinery—GroEL and GroES, the
growth, inhibition of transcription and loss in cellular
time of induction was very high. A large portion of the
functions. Over production of aconitase only may lead
cellular energy is involved in the folding process, result-
to formation of insoluble aggregates in the cell, resulting
ing in a slower rate of protein synthesis and hence, a
in reduced cell efficiency. GroEL has the property to trap
higher time of induction.
non-native aconitase, and preventing its aggregation in
Enhanced efficiency of correct folding of aconitase
cell enhancing efficiency of cell function, requiring less
in E. coli cells and the maximum percentage of native
time, of incubation after induction. In presence of exoge-
aconitase was found in the case when both GroEL and
nous GroEL and GroES, a large portion of energy in the
GroES chaperonin were co-expressed along with aconi-
form of ATP is used up for correct folding, as chap-
tase at 25 ◦C. Even though, the rate of protein synthesis is
eronin assisted protein folding is ATP driven reaction
much higher at 37 ◦C as compared to 25 ◦C, the extent of
P. Gupta et al. / The International Journal of Biochemistry & Cell Biology 38 (2006) 1975–1985
folding is higher at 25 ◦C. The higher rate of aggregation
Braig, K., Otwinowski, Z., Hegde, R., Boisvert, D. C., Joachimiak, A.,
reaction at 37 ◦C competes with the chaperone assisted
Horwich, A. L., et al. (1994). The crystal structure of the bacterial
folding reaction, resulting in the loss of a large portion
chaperonin GroEL at 2.8 A. Nature, 371, 578–586.
Bross, P., Andersen, B. A., Winter, V., Kr¨autle, F., Jensen, T. G.,
of the newly synthesized protein as aggregated mass.
Nandy, A., et al. (1993). Co-overexpression of bacterial GroESL
Generally, the extent of aggregation is greater at higher
chaperonins partly overcomes non-productive folding and tetramer
temperature due to the strong temperature-dependence
assembly of E. coli-expressed human medium-chain acyl-CoA
of the hydrophobic interactions, which dominate pro-
dehydrogenase (MCAD) carrying the prevalent disease-causing
tein aggregation The excep-
K304E mutation. Biochemica et Biophysica Acta (BBA)-MolecularBasis of Disease, 1182, 264–274.
tion being aconitase over expression in M15 cells at
Burkhardt-Holm, P., Schmidt, H., & Meier, W. (1998). Heat shock
37 ◦C. Enhanced folding of aconitase is observed due
protein (hsp70) in brown trout epidermis after sudden temperature
to increased expression of endogenous GroEL at higher
rise. Comparative Biochemistry and Physiology. Part A: Molecular
temperature. Small amounts of aconitase in the super-
and Integrative Physiology, 120, 35–41.
natant of the M15 cells over expressing recombinant
Caspers, P., Stieger, M., & Burn, P. (1994). Overproduction of bac-
terial chaperones improves the solubility of recombinant protein
aconitase and GroEL were found. This is due to the
tyrosine kinases in Escherichia coli. Cellular and Molecular Biol-
binding of the over expressed aconitase with GroEL cav-
ogy (Noisy-le-grand), 40, 635–644.
ity, without release of a folding competent intermediate.
Chaudhuri, T. K., Farr, G. W., Fenton, W. A., Rospert, S., & Horwich,
The protein storage function of GroEL has been stud-
A. L. (2001). GroEL/GroES mediated folding of a protein too large
ied and reported (When the cells
to be encapsulated. Cell, 107, 235–246.
Chen, M., & Mikecz, A. V. (2005). Formation of nucleoplasmic protein
are disrupted and the protein denatured for loading in
aggregates impairs nuclear function in response to SiO2 nanopar-
the SDS-PAGE, the GroEL bound aconitase is released
ticles. Experimental Cell Research, 305, 51–62.
and appears in the soluble fraction along with GroEL.
Christodoulou, E., & Vorgias, C. E. (2002). Understanding heterolo-
These results have been substantiated by aconitase assay
gous protein overproduction under the T7 promoter. Biochemistry
of all three strains at both the temperatures. Thus, the
and Molecular Biology Education, 30, 189–191.
Cortazzo, P., Cerve˜nansky, C., Mar´ın, M., Reiss, C., Ehrlich, R., &
aconitase that appears in the supernatant of M15 cells
Deana, A. (2002). Silent mutations affect in vivo protein folding
over expressing recombinant aconitase in the presence
in Escherichia coli. Biochemical and Biophysical Research Com-
of both GroEL and GroES was found to be biologically
munications, 293, 537–541.
Dubaqui´e, Y., Looser, R., F¨unfschilling, U., Jen¨o, P., & Rospert, S.
(1998). Identification of in vivo substrates of the yeast mitochon-drial chaperonins reveals overlapping but non-identical require-
ment for hsp60 and hsp10. The EMBO Journal, 17, 5868–5876.
Farr, G. W., Fenton, W. A., Chaudhuri, T. K., Clare, D. K., Saibil, H.
R., & Horwich, A. L. (2003). Folding with and without encapsula-
The authors acknowledge the generous gifts of pAco
tion by cis- and trans-only GroEL ± GroES complexes. The EMBO
plasmid from Prof. Sabine Rospert and pGroEL and
Journal, 22, 3220–3230.
pGroELS from Prof. A.L. Horwich. The work has
Fenton, W. A., & Horwich, A. L. (1997). GroEL mediated protein
been supported by Ministry of Human Resource and
folding. Protein Science, 6, 743–760.
Development (MHRD), Govt. of India and Industrial
Flores, S., de Anda-Herrera, R., Gosset, G., & Bolivar, F. G. (2004).
Growth-rate recovery of Escherichia coli cultures carrying a mul-
Research and Development Division (IRD), IIT, Delhi.
ticopy plasmid, by engineering of the pentose-phosphate pathway.
Ms. Nishtha Aggarwal and Ms. Pragya Batra are SURA
Biotechnology and Bioengineering, 87, 485–494.
awardees from IRD, IIT, Delhi.
Glick, B. R. (1995). Metabolic load and heterologous gene expression.
Biotechnology Advances, 13, 247–261.
Goenka, S., & Mohan Rao, C. (2001). Expression of recombinant z-
crystallin in Escherichia coli with the help of GroEL/ES and itspurification. Protein Expression and Purification, 21, 260–267.
Amrein, K. E., Takacs, B., Stieger, M., Molnos, J., Flint, N. A., &
Goloubinoff, P., Gatenby, A. A., & Lorimer, G. H. (1989). GroE heat-
Burn, P. (1995). Purification and characterization of recombinant
shock proteins promote assembly of foreign prokaryotic ribulose
human p50csk protein-tyrosine kinase from an Escherichia coli
bisphosphate carboxylase oligomers in Escherichia coli. Nature,
expression system overproducing the bacterial chaperones GroES
and GroEL. Proceedings of the National Academy of Sciences of
Hartl, F. U. (1996). Molecular chaperones in cellular protein folding.
the United States of America, 92, 1048–1052.
Nature, 381, 571–579.
Anfinsen, C. B. (1973). Principles that govern the folding of protein
Hartl, F. U., & Hayer-Hartl, M. (2002). Molecular chaperones in
chains. Science (Washington), 181, 223–230.
the cytosol: From nascent chain to folded protein. Science, 295,
Biswas, S., & Sharma, Y. D. (1994). Enhanced expression of Plas-
modium falciparum heat shock protein PFHSP70-I at higher tem-
Horwich, A. L., Low, K. B., Fenton, W. A., Hirshfield, I. N., & Furtak,
peratures and parasite survival. FEMS Microbiology Letters, 124,
K. (1993). Folding in vivo of bacterial cytoplasmic proteins: Role
of GroEL. Cell, 74, 909–917.
P. Gupta et al. / The International Journal of Biochemistry & Cell Biology 38 (2006) 1975–1985
Hunt, J. F., Weaver, A. J., Landry, S. J., Gierash, L., & Deisenhofer, J.
Ranson, N. A., Dunster, N. J., Burston, S. G., & Clarke, A. R. (1995).
(1996). The crystal structure of the GroES co-chaperonin at 2.8 A
Chaperonins can catalyse the reversal of early aggregation steps
resolution. Nature, 379, 37–45.
when a protein misfolds. The Journal of Biological Chemistry,
Jewett, A. I., Baumketner, A., & Shea, J. E. (2004). Accelerated fold-
ing in the weak hydrophobic environment of a chaperonin cavity:
Richardson, A., Landry, S. J., & Georgopoulos, C. (1998). The ins and
Creation of an alternate fast folding pathway. Proceedings of the
outs of a molecular chaperone machine. Trends in Biochemical
National Academy of Sciences of the United States of America,
Sciences, 23, 138–143.
Rosen, R., & Ron, F. Z. (2002). Proteome analysis in the study of the
Johnson, J. L., & Craig, E. A. (1997). Protein folding in vivo: Minire-
bacterial heat shock response. Mass Spectroscopy, 4, 244–265.
view unraveling complex pathways. Cell, 90, 201–204.
Sambrook, J., & Russell, D. (2001). Molecular cloning: A laboratory
Jordan, I. K., Rogozin, I. B., Wolf, Y. I., & Koonin, E. V. (2002). Essen-
manual (3rd ed.). New York: Cold Spring Harbor Laboratory Press
tial genes are more evolutionarily conserved than are nonessential
[Appendix 8].
genes in bacteria. Genome Research, 12, 962–968.
Sareen, D., Sharma, R., & Vohra, R. M. (2001). Chaperone-assisted
Kobayashi, M., Nomura, M., Fujita, Y., Okamoto, T., & Ohmomo, S.
overexpression of an active D-Carbamoylase from Agrobacterium
(2002). Influence of lactococcal plasmid on the specific growth rate
tumefaciens AM 10. Protein Expression and Purification, 23,
of host cells. Letters in Applied Microbiology, 35, 403–408.
Kusukawa, N., & Yura, T. (1988). Heat shock protein GroE of
Schumann, W., & Ferreira, L. (2004). Production of recombinant pro-
Escherichia coli: Key protective roles against thermal stress. Genes
teins in Escherichia coli. Genetics and Molecular Biology, 27,
and Development, 2, 874–882.
Laemmli, U. K. (1970). Cleavage of structural proteins during the
Song, C. Z., Bai, Z. L., Song, Z. Z., & Wang, Q. W. (2003). Aggre-
assembly of the head of bacteriophage T4. Nature, 227, 680–685.
gate formation of hepatitis B virus X protein affects cell cycle and
Lee, K., & Moon, S. K. (2003). Growth kinetics of Lactococcus lac-
apoptosis. World Journal of Gastroenterology, 9, 1521–1524.
tis ssp. diacetylactis harboring different plasmid content. Current
Sørensen, H. P., & Mortensen, K. K. (2005). Soluble expression of
Microbiology, 47, 17–21.
recombinant proteins in the cytoplasm of Escherichia coli. Micro-
Lee, S. C., & Olins, P. O. (1992). Effect of overproduction of heat shock
bial Cell Factories, 4, 1–8.
chaperones GroESL and DnaK on human procollagenase produc-
Squier, T. C. (2001). Oxidative stress and protein aggregation during
tion in Escherichia coli. The Journal of Biological Chemistry, 267,
biological aging. Experimental Gerontology, 36, 1539–1550.
Toye, P., & Remold, H. (1989). The influence of temperature and serum
Lin, Z., & Rye, H. S. (2004). Expansion and compression of a protein
deprivation on the synthesis of heat shock proteins and alpha and
folding intermediate by GroEL. Molecular Cell, 16, 23–34.
beta tubulin in promastigotes of Leishmania major. Molecular and
Llorca, O., Gal´an, A., Carrascosa, J. A., Muga, A., & Valpuesta, J.
Biochemical Parasitology, 35, 1–10.
M. (1998). GroEL under heat-shock switching from a folding
Ueno, T., Taguchi, H., Tadakuma, H., Yoshida, M., & Funatsu, T.
to a storing function. The Journal of Biological Chemistry, 273,
(2004). GroEL mediates protein folding with a two successive timer
mechanism. Molecular Cell, 14, 423–434.
McLennan, N., & Masters, M. (1998). GroE is vital for cell-wall syn-
Vorderwlbeckea, S., Kramerb, G., Merzc, F., Kurzc, T. A., Rauchc, T.,
thesis. Nature, 392, 139.
Zachmann-Brandc, B., et al. (2004). Low temperature or GroEL/ES
Milnitsky, F., Frioni, L., & Agius, F. (1997). Characterization of Rhizo-
overproduction permits growth of Escherichia coli cells lacking
bia that nodulates native legume trees from Uruguay. Soil Biology
trigger factor and DnaK. FEBS Letters, 559, 181–187.
and Biochemistry, 29, 989–992.
Wong, P., & Houry, W. A. (2004). Chaperone networks in bacteria:
Miot, M., & Betton, J. M. (2004). Protein quality control in the bacterial
Analysis of protein homeostatis in minimal cells. Journal of Struc-
periplasm. Microbial Cell Factories, 3, 1–13.
tural Biology, 146, 79–89.
Morrison, J. F. (1954). The activation of aconitase by ferrous ions and
Xu, Z., Horwich, A. L., & Sigler, P. B. (1997). The crystal structure
reducing agents. Biochemical Journal, 58, 685–692.
of the asymmetric GroEL–GroES–(ADP)7 chaperonin complex.
Nishihara, K., Kanemori, M., Yanagi, H., & Yura, T. (2000). Over-
Nature, 388, 741–749.
expression of trigger factor prevents aggregation of recombinant
Yura, T., Nagai, H., & Mori, H. (1993). Regulation of heat
proteins in Escherichia coli. Applied and Environmental Microbi-
shock response in bacteria. Annual Review of Microbiology, 47,
ology, 66, 884–889.
Source: http://web.iitd.ernet.in/~tkchaudhuri/Co-expression%20of%20chaperonin%20GroELGroES%20enhances%20in%20vivo%20folding.pdf
Remove the Muzzle and Give Rule 37(b) Teeth: Advocating for the Imposition of Sanctions for Rule 26(c) Protective Order Violations in the Eleventh CircuitAmber M. Bishop Follow this and additional works at: Recommended CitationAmber M. Bishop (2014) "Remove the Muzzle and Give Rule 37(b) Teeth: Advocating for the Imposition of Sanctions for Rule 26(c)Protective Order Violations in the Eleventh Circuit," Georgia State University Law Review: Vol. 31: Iss. 2, Article 5.Available at:
[Save eerst dit bestand als XXX(titel).doc] The welfare effects A pilot study for the Netherlands Apostolos Tsiachristas Research commissioned by the American Chamber of Commerce Pharma-ceutical Committee © Aarts De Jong Wilms Goudriaan Public Economics bv (APE) and Maastricht University Den Haag, January 2008