Animals all experiments were approved by and conducted in accordance with the regulations of the local animal care and use committee
Effects of recombinant human erythropoietin in the
cuprizone mouse model of de- and remyelination
for the award of the degree
"Doctor rerum naturalium"
Division of Mathematics and Natural Sciences
of the Georg-August-University Göttingen
submitted by
Nora Hagemeyer
from Göttingen
Göttingen 2012
Doctoral thesis committee
Prof. Dr. Dr. Hannelore Ehrenreich (Advisor, First Referee)
Division of Clinical Neuroscience
Max Planck Institute of Experimental Medicine
Hermann-Rein-Straße 3
37075 Göttingen
Prof. Dr. Thomas Bayer (Second Referee)
Division of Molecular Psychiatry
Department of Psychiatry
University of Göttingen
Von-Siebold-Straße 5
37075 Göttingen
Prof. Dr. Klaus-Armin Nave
Department of Neurogenetics
Max Planck Institute of Experimental Medicine
Hermann-Rein-Straße 3
37075 Göttingen
Date of submission of the thesis: March 31, 2012
Date of oral examination: May 18, 2012
I hereby declare that this thesis has been written independently with no other sources
or aids than quoted.
Göttingen, March 31, 2012 Nora Hagemeyer
I would like to thank everybody who has contributed to the success of my doctoral
First of all I would like to express my gratitude to Prof. Hannelore Ehrenreich for
giving me the opportunity to work on very interesting projects under her supervision
in her lab and for her continuous support and guidance during my whole PhD period.
Furthermore I want to thank the additional members of my thesis committee, Prof.
Thomas Bayer and Prof. Klaus-Armin Nave, for their important advice and
constructive criticism.
I want to thank Susann Boretius for all her contributions to the studies and for the
open minded conversations we always had.
I am particularly grateful to Swetlana Sperling, Anja Ronnenberg and Kathrin Hannke
for their outstanding support during the last years, and Christoph Ott, Axel von
Streitberg and Henrike Welpinghus for their great assistance of the analyses of the
„cuprizone project‟. It was a pleasure for me to be your supervisor. Many thanks to
Sergi Papiol as well as the entire behavior team; you all encouraged me a lot.
I very much enjoyed the friendly, supportive and helpful working atmosphere in our
lab – therefore I would like to thank all the present and past members of the Division
of Clinical Neuroscience, especially Liane Dahm, Sabrina Grube, Imam Hassouna,
Erin Choi, Bartosz Adamcio and Derya Sargin.
Thanks to Anton Safer for his expertise concerning statistics.
I want to thank my family and friends for all their continuous motivation and
encouragement during the last years.
And last, but not least, special thanks to Micha.
My utmost thanks to my parents Renate & Michael Hagemeyer
for their never-ending love, support and encouragement.
TABLE OF CONTENTS
Auditory brain stem response
Acoustic evoked potential
Adenomatous polyposis coli
Amyloid precursor protein
Blood-brain-barrier
Bromodeoxyuridine
Complement component 1, q subcomponent, A chain
Chemokine (C-C motif) ligand 2
Chemokine (C-C motif) receptor 2
Cluster of differentiation
Ceramide galactosyl transferase
2‟,3‟-cyclic nucleotide 3'-phosphodiesterase
CXC chemokine receptor-2
Diaminobenzidine
Dopamine beta hydroxylase
Double distilled water
Accumulative distance in meters
Maximum run duration
Diffusion tensor imaging
Experimental autoimmune encephalomyelitis
Electroencephalography
Ethylene glycol tetraacetic acid
Electron microscopy
Elevated plus maze
Erythropoietin receptor
Fumaric acid esters
Fibroblast-growth-factor 2
Glyceraldehyde-3-phosphate dehydrogenase
Glial fibrillary acidic protein
Glutathione S-transferase-pi
Haematoxylin & Eosin
Hypoxanthin-Phosphoribosyltransferase 1
Intra-peritoneal
Ionized calcium binding adapter molecule-1
Interferon-gamma
Insulin-like growth factor-1
International unit
Luxol Fast Blue-periodic acid Schiff
Myelin associated glycoprotein
Monoamine oxidase
Myelin basic protein
Major histocompatibility complex
Macrophage-inflammatory protein-1 alpha
Myelin oligodendrocyte glycoprotein
Motor skill sequence
Methylprednisolone
Magnetic resonance imaging
Multiple sclerosis
Magnetization transfer ratio
Microliter/Micromole
Sodium orthovanadat
Natrium chloride
Nicotinamide adenine dinucleotide
Nerve/glial antigen 2
Neurite outgrowth inhibitor-A
Nitric oxide synthase (inducible; neuronal; endothelial)
Number of individual runs
Oligodendrocyte transcription factor
Phosphate buffered saline
Platelet-derived growth factor receptor-alpha
Paraformaldehyde
Prefrontal cortex
Phosphatidylinositol 3-kinase
Proteolipid protein
Pre-pulse-inhibition
Parts per million
Quantitative real-time RT-PCR
Ras-mitogen-activated protein kinase
Ricinus communis agglutinin-1
RNA/mRNA Ribonucleic acid/ messenger Ribonucleic acid
Region of interest
Resolutions per minute
Sodium dodecyl sulfate
Standard error of the mean
Stratum lacunosum moleculare
Neurofilament H non-phosphorylated
Signal transducers and activators of transcription
Triiodothyronine
Tris-buffered saline + Tween20
Transforming growth factor-β
Tumor necrosis factor receptor
Tumor necrosis factor alpha
Triggering receptor expressed on myeloid cells-2
Tris(hydroxymethyl)aminomethane hydrochloride
TNF-like weak inducer of apoptosis
Volume per volume
Maximum running velocity (resolutions/minute)
Weight per volume
Erythropoietin (EPO) has potent neuroprotective/neuroregenerative properties in
various forms of experimental autoimmune encephalomyelitis (EAE), i.e. established
rodent models of acute multiple sclerosis (MS), and in patients suffering from chronic
progressive MS. However, the mechanisms of EPO action in these conditions is still
oligodendrocytes/myelin in the absence of immune-inflammatory components, which
are characteristic for acute MS but not for the chronic progressive state of the
disease, are lacking. Therefore, in this PhD thesis, the cuprizone mouse model was
employed to investigate the effect of EPO on toxic demyelination. This model allows
investigation of myelination processes independent of T-cell mediated inflammation.
Feeding of mice with 0.2% cuprizone mixed into ground chow results in
demyelination of the corpus callosum, whereas withdrawal of the toxin leads to
spontaneous remyelination. The hypothesis of the present thesis was that EPO
modulates both, cuprizone-induced demyelination and the remyelination upon toxin-
withdrawal. Two study designs were chosen to investigate the effects of EPO in a
clinically most relevant manner: (1) EPO treatment was started immediately after
cessation of 6 weeks of cuprizone feeding, i.e. at the time point of full damage and
initiation of recovery/remyelination, or (2) EPO was given after 3 weeks of toxin
application and continued for 3 weeks until cessation of cuprizone feeding to catch
the demyelination phase. For both study parts, a 'double-blind' (for food/injections),
placebo-controlled, longitudinal 4-arm design, using 8 week old male C57BL/6 mice,
was applied. Target parameters included behavioral analyses, magnetic resonance
imaging, and histology, as well as measurement of protein and mRNA levels. The
cuprizone mouse model emerged as a highly variable animal model, making deeper
mechanistic analyses of EPO effects difficult. Despite these limitations and a lack of
clear effects of EPO on remyelination, EPO showed surprisingly distinct results when
applied during the demyelination phase. Immediately after termination of cuprizone
feeding, EPO revealed beneficial effects on vestibulomotor function/coordination,
magnetic resonance imaging readouts and inflammation, as reflected by the number
of microglia in the corpus callosum. Importantly, for the first time, EPO was found to
reduce axonal degeneration in brain white matter tracts. These findings are of high
relevance with respect to novel treatment strategies for demyelinating diseases such
1 INTRODUCTION
My PhD thesis is based on two projects, which both resulted in first author
publications enclosed in the supplement of this thesis. In the first paper,
"Erythropoietin attenuates neurological and histological consequences of toxic
demyelination in mice," consequences of cuprizone-induced demyelination and the
effect of erythropoietin (EPO) as a potential treatment strategy on these parameters
were investigated. The second study, "A myelin gene causative of a catatonia-
depression syndrome upon aging," analyzed the pathophysiological consequences of
an altered expression of the myelin gene 2‟,3‟-cyclic nucleotide 3'-phosphodiesterase
(CNP). Additionally, two co-author publications are enclosed.
In this PhD thesis, I would like to focus on my main project analyzing the effect of
EPO on de- and remyelination processes. I will elaborate mainly upon unpublished
data of this project and include the published data as well.
1.1 Cuprizone
The discovery of cuprizone (oxalic acid bis(cyclohexylidene hydrazide) as an agent
with copper chelating properties dates back to the 1950s. Gustav Nilsson
demonstrated that cuprizone reacts with copper to produce a stable blue color and
that this reaction was very sensitive even at low concentrations of copper (Nilsson,
1950). The technique was further described as a tool to detect copper levels in pulp
and paper, in iron, steel and ferrous alloys and even in serum (Peterson & Bollier,
1955; Wetlesen, 1957). The cuprizone-copper complex has a molar absorbance at
595 nm and is stable at a pH of 7-9 (Benetti et al, 2010; Messori et al, 2007;
Peterson & Bollier, 1955). However, the exact chemical property of the cuprizone-
copper complex that results in an intense blue color is still not completely understood
and is described to be rather complex. On one hand, it is suggested that cuprizone in
the cuprizone-copper complex stabilizes copper (III); on the other hand, it is shown
that only copper (II) is present in the cuprizone-copper complex (Benetti et al, 2010;
Messori et al, 2007; Zatta et al, 2005).
1.2 The cuprizone animal model
1.2.1 Early history and development of the animal model
The initial idea of the cuprizone model was to mimic copper deficiency in animals.
Copper is an essential trace element and it was observed that copper deficit in the
food of pregnant ewes can lead to neurological impairments and lesions of
demyelination in offspring. However, the proper animal model to study the cause and
pathogenesis of the disease was missing (Carlton, 1966). In 1966 Carlton had the
idea to use copper-chelating agents in experimental animals to mimic a copper
deficiency and to study its consequences (Carlton, 1966). He used weanling male
mice or pregnant mice and fed them cuprizone in a dose of 0.1% or 0.5% mixed into
a chicken mash diet for 7 weeks. Additionally, he analyzed the effect of 0.5%
cuprizone supplemented with different concentrations of copper sulfate. The lower
dose of cuprizone resulted in slightly reduced growth, cerebellar edema and
demyelination in weanling mice but did not affect pregnancy. However, high-dose
cuprizone led to an increased mortality in the offspring of pregnant mice and a severe
decrease in growth, increased mortality, paresis, cerebellar edema, demyelination
and hydrocephalus in weanling mice. In general, supplementation of copper sulfate
did not change the effect of cuprizone. After this first report of cuprizone application
in mice, several studies followed to further characterize the model. The first two
subsequent studies were performed by Carlton himself, wherein he demonstrated
that spongy degeneration, astrogliosis and hydrocephalus were present at early
stages (weeks 2-5) of cuprizone intoxication; myelin loss was first present at week 9.
Moreover, it was seen that with increasing age, mice were less susceptible to 0.5%
cuprizone (Carlton, 1967). Interestingly, it was observed that rats and guinea pigs
were less susceptible to cuprizone than mice, showing a difference between species
(Carlton, 1969; Love, 1988). Other studies confirmed previous findings in cuprizone-
fed mice of an elevated mortality rate, hydrocephalus, status spongiosus and
reactive/hypertrophic astrocytes, which were mainly studied in cerebellar white
matter but described as well e.g. in brain stem, cerebellar cortex, hippocampus and
corpus callosum (Blakemore, 1972; Kesterson & Carlton, 1971; Pattison & Jebbett,
1971; Pattison & Jebbett, 1973; Suzuki & Kikkawa, 1969; Venturini, 1973). It was
specified that the histopathological changes occured bilaterally (Pattison & Jebbett,
1971). The formation of vacuoles in myelin sheaths and swollen astrocytes were
thought to be possible causes of spongy degeneration in the brain stem and both
cerebral and cerebellar white matter (Suzuki & Kikkawa, 1969; Venturini, 1973).
Additionally, enlarged and giant mitochondria in the liver were found in the same two
studies, revealing toxic adverse effects in the peripheral system under cuprizone
treatment. Meanwhile, Pattison and Jebbett were the first to describe potential for
recovery in the cuprizone model. Mice of the BSVS strain were repeatedly fed with
0.5% cuprizone, followed by a normal food diet after the first and second "cuprizone-
cycle". They found all known histopathological changes during the first and second
cycle of cuprizone feeding. In both periods of normal food, mice recovered from the
previous symptoms and only slightly enlarged ventricles could still be seen at the end
of the recovery phase (Pattison & Jebbett, 1973). This finding was important for
future studies. Up until this point, all investigators had mainly focused on the aspect
of spongy degeneration, a common finding in neurological disorders like scrapie
disease. Blakemore was the first to put attention on the degeneration of
oligodendrocytes and reported an increase of microglia upon cuprizone intoxication
(Blakemore, 1972). With electron microscopy he observed degenerated
oligodendrocytes early after cuprizone intoxication, followed by demyelinated axons
and the appearance of remyelinating oligodendrocytes in several brain regions. Since
then, degeneration of oligodendrocytes became the main focus in the cuprizone
model and it developed into a model which allows investigation of de- and
remyelination processes.
A detailed description of these studies is presented in Table 1.
Table 1: Early history and development of the cuprizone model.
Experimental set-up
Male weanling mice:
Trial 1: Slightly reduced growth; cerebellar edema and demyelination.
7 week feeding with
Trial 2: Severely decreased growth; increased mortality; weakness in
Trial 1: 0.1% cuprizone
mice, paresis evident; cerebellar edema and demyelination;
Trial 2: 0.5% cuprizone
Trial 3: 0.5% cuprizone +
Trial 3: No effect of added copper on brain lesions.
0.1% cuprizone did not affect pregnancy.
cuprizone (0.1 or 0.5%)
0.5% cuprizone: no delivery when feeding started on day 3; increased
feeding started on day 3 or
percentage of nonviable young when feeding started at day 9;
9 of gestation ± copper
increased number of viable young by supplementation of 130ppm
1967 Weanling albino
Trial 1: Feeding of
Trial 1: Feeding of the chemical precursors of cuprizone had no toxic
weanling mice with
oxaldihydrazide (chemical
precursors of cuprizone) for 7 weeks
Trial 2: A vitamin mixture, riboflavin and vitamin A supplement reduced
Trial 2: Supplementation of the mortality rate; no further effects.
several vitamins and a
vitamin mixture to 0.5%
cuprizone diet for 7 weeks
Trial 3: No effect of Diurill supplement.
Trial 3: Supplementation of
Diurill to 0.5% cuprizone
diet for 7 weeks
Trial 4: 130ppm copper reduced incidence of hydrocephalus.
Trial 4: Supplementation of
130ppm/260ppm copper to
0.2% cuprizone diet for 7
4-8 week old male
Trial 5: 4 or 8 week old
Trial 5: With increasing age at the start of cuprizone feeding fewer mice
male mice received 0.5%
developed hydrocephalus.
cuprizone diet for 8 weeks
Trial 6: Time scale
Trial 6: Spongy degeneration observed after 2 weeks; astrogliosis
experiment, feeding of
occurred at week 4; hydrocephalus observed at week 5; myelin loss
0.3% cuprizone and weekly apparent after 9 weeks. analysis of mice
1969 Weanling albino
Rats: Feeding with 0.1, 0.5, 0.5% cuprizone: increased mortality rate; enlarged and swollen
1 or 1.5% cuprizone over 8
astrocytes, edema and status spongiosus in several brain regions.
1 & 1.5% cuprizone: Death of half of the rats in weeks 3-4. No
hydrocephalus observed.
Male albino guinea
Guinea pigs: Feeding with
0.75% cuprizone: higher mortality rate.
0.5, 0.75 or 1% cuprizone
1% cuprizone: mortality rate further increased; small lesions present; no
hydrocephalus observed.
1969 Weanling Swiss-
Feeding of 0.5% cuprizone
CNS: Status spongiosus (most prominent in brain stem and cerebellar
Webster male mice
white matter) caused by formation of vacuoles in myelin sheaths and in
the cytoplasm of glial cells. Liver: Giant mitochondria and proliferation of the smooth endoplasmic reticulum.
1970 Weanling Swiss
Feeding of 0.3, 0.5 or
Induction of hydrocephalus occurred secondary to stenosis of the
albino male mice
0.75% cuprizone up to 8
aqueduct of Sylvius. May have resulted due to pressure exerted by the
surrounding edematous tissue. (Normal CSF secretion)
1971 4-6 week old BSVS Feeding of 0.5% cuprizone
Increased mortality rate; extracellular vacuolation and hypertrophic
astrocytes in cerebellar white matter, pons and midbrain (bilaterally)
1971 Weanling Swiss
Feeding of 0.3% cuprizone
Status spongiosus (prominent in thalamus, cerebellar medulla, reticular
albino male mice
formation, corpus callosum, cerebellar peduncle, internal capsule, pes pedunculi, medial geniculate body, cerebellar folia); edema (cerebral cortex, basal ganglia, hippocampus); reactive astrocytes (cerebral cortex, putamen, hippocampus, caudate putamen, corpus callosum, ventral thalamic nucleus, cerebellar folia, cerebellar nucleus). Increased activity of several enzymes in astrocytes, most prominently: glutamate dehydrogenase, NAD diaphorase
1973 3-6 week old BSVS Feeding of 0.5% cuprizone
Confirmation of previous studies: mortality rate increased; older mice
less vulnerable to cuprizone.
followed by 60 days with
After 60 day recovery: no changes in mice fed for 1, 2 or 3 weeks with
cuprizone before; rarefaction of tissue in vicinity to slightly dilated
ventricles in mice fed with cuprizone for 4 and 6 weeks.
Repeated feeding: 37 days
Repeated feeding: Spongiform vacuolation, dilatation of ventricles and
cuprizone followed by 52
increased number of astrocytes and microglia after 37days cuprizone,
days normal food, again
after 34 days on normal diet only slightly dilated ventricles detected.
cuprizone for 38 days
Histopathology in second cuprizone cycle similar to the first, no changes
followed by 52 days normal
after second cycle of withdrawal of cuprizone. Fast physical recovery
after cuprizone withdrawal.
1973 30 day old Swiss
Feeding with 0.5%
Growth retardation; impaired motility of hind limbs; status spongiosus
cuprizone or copper-
(brain stem and cerebral and cerebellar white matter) due to vacuoles
chelated cuprizone up to 4
within the myelin sheaths and swollen astrocytes. Enlarged and giant
mitochondria in liver cells. In brain and liver: Reduced activity of monoamine oxidase and cytochrome oxidase; increased activity of succinate dehydrogenase. Decreased dry weight of brains after cuprizone treatment; increased Na+ levels, decreased K+ and Cu+ levels in brain tissue. Feeding of copper-chelated cuprizone: no degenerative effects.
1.2.2 The cuprizone model of demyelination and remyelination
The first discovery of cuprizone-induced degeneration of oligodendrocytes and
demyelination led to further characterization of the model. The first studies focused
on the superior peduncle and found that feeding of weanling ICI male mice with 0.5%
cuprizone resulted in a distinct time course of demyelination which started at week 2,
peaked at week 5 and stayed constant until week 8; morphological changes in
astrocytes and microglia were observed (Blakemore, 1973a). It was seen that
withdrawal of cuprizone from the diet for 6 weeks led to remyelination, however,
myelin sheaths were thinner compared to control mice (Blakemore, 1973b). Similar
results from others confirmed the potential of remyelination by withdrawal of
cuprizone (Blakemore, 1974; Ludwin, 1978) and made the model even more
interesting to study not only the aspect of demyelination but also remyelination.
However, some variations in the time course of de- and remyelination between
different studies could be the result of a different susceptibility of older mice and
different mouse strains to cuprizone, as well as variations in the cuprizone
concentrations used (Blakemore, 1974; Carlton, 1967; Ludwin, 1978). Since it was
discovered that 8-10 week old C57BL/6 mice fed with 0.2% cuprizone showed clear
demyelination of the corpus callosum, but did not show liver toxicity, this strain was
preferentially used in future studies (Hiremath et al, 1998). Moreover, the corpus
callosum became the main target region for the analysis of myelination (for detailed
descriptions of the studies please see Table 2). A generally important characteristic
of the cuprizone model is to find an intact blood-brain-barrier (BBB) (Bakker &
Ludwin, 1987; Kondo et al, 1987).
1.2.2.1 Characterization of cuprizone-induced damage
Demyelination and remyelination in the corpus callosum are mainly studied
histologically using Luxol Fast Blue-periodic acid Schiff (LFB-PAS) and
immunohistochemically using different markers for myelin proteins (e.g. myelin basic
protein (MBP), proteolipid protein (PLP)). These techniques allow a subjective
(observer blinded) semi-quantitative analysis by rating the staining on a scale of
severity of demyelination. A more precise but labor intensive analysis of myelin via
electron microscopy is less frequently performed. Consequences of cuprizone
intoxication on myelin in the corpus callosum are studied after acute (6 weeks) or
chronic (12-16 weeks) application. Figure 1 summarizes the morphological and
cellular changes in the corpus callosum after acute cuprizone feeding as described in
detail below. Demyelination after acute administration of cuprizone starts at week 3
and is almost complete in weeks 5-6 (Gao et al, 2000; Hiremath et al, 1998; Mana et
al, 2006; Matsushima & Morell, 2001; Merkler et al, 2005; Morell et al, 1998;
Remington et al, 2007). Interestingly, intrinsic remyelination already starts at week 6
of cuprizone feeding (Irvine & Blakemore, 2006; Mason et al, 2000; Mason et al,
2001a). Long-term feeding of cuprizone induces episodic de- and remyelination
within the corpus callosum, showing the potential of intrinsic remyelination by weeks
6 and 12 even during continuous application of cuprizone (Mason et al, 2001a).
Withdrawal of cuprizone after acute demyelination leads to almost complete
remyelination on an immunohistochemical level over 6 weeks, whereas remyelination
after chronic cuprizone treatment leads to a slower and incomplete remyelination
even after 12 weeks (Armstrong et al, 2006; Crawford et al, 2009; Lindner et al,
2008; Mason et al, 2001a; Matsushima & Morell, 2001; Morell et al, 1998). Based on
electron microscopy, however, it is known that the recovery of myelin even 6 weeks
after acute demyelination is also still incomplete (Crawford et al, 2009; Lindner et al,
2008; Merkler et al, 2005). During demyelination the expression levels of several
myelin genes are altered; MBP, myelin associated glycoprotein (MAG), ceramide
galactosyl transferase (CGT), and PLP are gradually downregulated starting at week
1 and reaching a minimal expression level in weeks 2-4. Interestingly, re-expression
of the genes starts already at week 5, and at the beginning of the recovery phase,
the gene expression is even higher compared to controls (Gao et al, 2000; Morell et
Oligodendrocytes are the myelinating cells in the central nervous system and of
special interest for evaluation in the cuprizone model. The characterization of the
effect of cuprizone on oligodendrocytes is mainly based on immunohistochemistry
using the antibodies: glutathione S-transferase-pi (GST-pi), adenomatous polyposis
coli (APC) CC-1 and Nogo-A, for mature oligodendrocytes and nerve/glial antigen 2
(NG2) or platelet-derived growth factor receptor-alpha (PDGFRα) for precursor
oligodendrocytes. The number of mature oligodendrocytes gradually decreases upon
acute cuprizone intoxication reaching the lowest levels in weeks 5-6 and an intrinsic
reappearance of oligodendrocytes is observed at week 6. After 2 weeks of
remyelination, oligodendrocytes are already further increased and reach control
levels until week 10. The number of precursor oligodendrocytes increases until
weeks 3-5 and is followed by a slight decrease. However, the overall number
remains elevated even at week 10 of recovery (Arnett et al, 2001; Crawford et al,
2009; Gudi et al, 2009; Mason et al, 2000; Matsushima & Morell, 2001). Chronic
demyelination leads to a depletion of mature oligodendrocytes until weeks 5-6,
however, a population of cells reappears until week 12 of cuprizone feeding. In this
condition, precursor oligodendrocytes increase until week 5 but are progressively lost
upon further intoxication (Mason et al, 2004). Oligodendrocytes are mainly depleted
by apoptosis (Mason et al, 2000; Mason et al, 2004). Astrocytes are gradually
upregulated and hypertrophic during acute demyelination and stay at a high level in
the recovery phase (Crawford et al, 2009; Gudi et al, 2009; Hiremath et al, 1998). A
similar pattern is observed under chronic conditions (Lindner et al, 2009). The
number of microglia is highly upregulated with a peak in weeks 5-6 during acute and
chronic demyelination. Removal of cuprizone after 6 weeks leads to a fast decline to
control levels 2-5 weeks later (Arnett et al, 2001; Gudi et al, 2009; Hiremath et al,
1998; Lindner et al, 2009; Mason et al, 2004; Merkler et al, 2005; Morell et al, 1998).
During chronic exposure, microglia decline but stay elevated after week 6, and during
a following recovery phase, microglia are present at a very low level (Lindner et al,
2009; Mason et al, 2004). It is suggested that microglia increase their phagocytic
activity during cuprizone-induced demyelination (Voss et al, 2012). Acute axonal
degeneration (investigated with the antibody amyloid precursor protein (APP)) is
present 3-6 weeks after cuprizone intoxication (Crawford et al, 2009; Lindner et al,
2009; Merkler et al, 2005; Song et al, 2005) and suggested to gradually decrease
after weeks 3-4 (Lindner et al, 2009; Song et al, 2005). Results for an additional
marker for axonal degeneration (Neurofilament H non-phosphorylated (SMI-32)) are
rare and so far inconclusive (Lindner et al, 2009; Sun et al, 2006). Swollen and
dystrophic axons are observed with electron microscopy 5-6 weeks after cuprizone
feeding and can even be found in the first 2 weeks of recovery (Irvine & Blakemore,
2006; Stidworthy et al, 2003). Furthermore, functional axon damage is seen by a
conduction deficit during demyelination, which is not fully recovered by a 6 week
remyelination period (Crawford et al, 2009).
Cuprizone-induced demyelination is not restricted to the corpus callosum and
additionally present in the cortex, hippocampus and cerebellum (Groebe et al, 2009;
Hoffmann et al, 2008; Koutsoudaki et al, 2009; Norkute et al, 2009; Skripuletz et al,
2008; Skripuletz et al, 2010b). Please find a detailed summary of the main cuprizone
articles in Table 2.
Figure 1: Overview of the morphological and cellular changes
during acute cuprizone feeding for 6 weeks and within a 6 week
recovery period.
Table 2: The cuprizone model of de- and remyelination. Studies are sorted chronologically within the subgroups. Antibodies and/or methods used are given in
Experimental set-up
Blakemore 1972 Weanling albino
Feeding of 0.5% cuprizone
From 1st week on: Astrocytosis (cerebral cortex, caudate-putamen,
for 1, 2, 4 and 5 weeks
thalamus, midbrain); status spongiosus (internal capsule, anterior
oligodendrocytes
commissure, thalamus, midbrain, cerebellum, white matter of
cerebellum); degenerated oligodendrocytes (cerebral cortex and white
matter). Increased number of microglia at week 3. Remyelinating oligodendrocytes and a large number of demyelinated axons present at week 5.
Analysis in the superior peduncle
1973 Weanling albino
Feeding with 0.5% cuprizone
From 2nd week on: Degenerated oligodendrocytes. Demyelination
peaked at week 5 and stayed constant until week 8; demyelination
accompanied by morphological changes of astrocytes and microglia, cells described as remyelinating oligodendrocytes during demyelination.
1973 Weanling male
Feeding with 0.5% cuprizone
Withdrawal of cuprizone from the diet: Induction of remyelination. After
for 5 weeks followed by
4-6 weeks almost all axons remyelinated ( 88%). Remyelinated
normal food up to 6 weeks
sheaths thinner, axon-fiber diameter ratio not back to control levels.
1974 9 month old albino
Feeding of 0.75% cuprizone
Start of demyelination at week 7 of feeding, almost complete at week
up to 10 weeks followed by
10. Almost complete remyelination after 6 and 12 weeks on normal diet.
normal food up to 12 weeks
Remyelinated sheaths thinner compared to controls.
1978 Weanling Swiss
Feeding of 0.6% cuprizone
Weeks 1-4 of cuprizone: Higher mortality rate. Hydrocephalus in most of
for 6-7 or up to 25 weeks.
the mice. Degeneration of oligodendrocytes from 2 weeks on; almost
The 6-7 week feeding period
complete demyelination at week 7, no further change in the grade of
was followed by normal
demyelination thereafter. Peak of phagocytic macrophages at week 5
feeding up to 18 weeks
followed by a decrease. Reactive astrocytes and other undefined reactive and immature cells present at week 4. Recovery: Fast capacity of remyelination until week 4 but slow capacity until week 18. Myelin sheaths only reached 50% of normal myelin thickness.
1988 Weanling male
Feeding of 0.5, 1 or 2%
Feeding of 1 or 2% cuprizone: higher mortality, weakness and wasting;
cuprizone up to 15 weeks. 3
intramyelinic edema (cerebral white matter, hilum of the dentate nucleus severely affected
rats fed with 0.1% cuprizone
and superior cerebellar peduncle), rarely degenerated
were returned to normal diet
oligodendrocytes, no demyelination. Mild axonal degeneration in sciatic
nerve. Complete recovery after 3 weeks of withdrawal of cuprizone.
Analysis of the blood-brain-barrier (BBB)
1987 Weanling CD1
Feeding of 0.5-0.6%
BBB proven to not be permeable by horseradish peroxidase tracer
cuprizone over 9 weeks
method & immunohistochemically using antisera to extravasated serum proteins. Mice with cortical lesions served as positive control.
1987 3 week old Swiss-
Feeding of 0.5% cuprizone
BBB proven to not be permeable by the horseradish peroxidase tracer
method (cerebrum, brainstem, spinal cord).
Analysis in the corpus callosum (CC)
1998 8-10 week old
Feeding of 0.1 to 0.6%
Severe body weight loss with increasing cuprizone concentration. Liver
cuprizone for 6 weeks
only affected under 0.4% and 0.5% cuprizone. Complete demyelination
(LFB, MBP) of the CC with 0.2-0.5% cuprizone at week 6.
Feeding of 0.2% cuprizone
Start of demyelination at week 3; completion of demyelination at week
over 6 weeks; mice were
6; no further detrimental toxic effects. Astrocytosis paralleled to
sacrificed weekly
demyelination; microglia/macrophages (RCA-1) appeared in the 1st week & increased further.
Feeding of 0.2% cuprizone
20% body weight loss within 1st week; demyelination (LFB) in CC
up to 6 weeks followed by
started at week 3, maximal in weeks 4-6. MBP, MAG & CGT-mRNA
normal food up to 6 weeks
levels decreased at week 1, minimal at week 3, returned to normal levels until week 6; elevated expression levels at the beginning of recovery. Microglia (RCA-1; lysozyme) followed pattern of demyelination.
Feeding of 0.2% cuprizone
IFN-γ transgenic mice (very low level of IFN-γ expression): Resistant to
Role of IFN-γ in
C57BL/6 & IFN-γ
for up to 6 weeks
cuprizone-induced demyelination in the CC; no changes on the number
of astrocytes, microglia & apoptotic cells. MBP & PLP-mRNA levels
decreased in weeks 2-4. IGF-1 increased.
Mason et al. 2000 8 week old
Feeding of 0.2% cuprizone
Mature oligodendrocytes (GST-pi) almost completely depleted (largely
up to 6 weeks followed by
by apoptosis) at week 6 and reappeared during remyelination phase.
normal food up to 6 weeks
NG2+ cell proliferation in the subventricular zone and accumulation in the CC upon demyelination (peak at week 4). NG2+ cells switched from a bipolar to a branch-like phenotype in advance to the repopulation of GST-pi+ cells. IGF-1 expression upregulated with a peak at week 4 and remained elevated until week 7 (potentially involved in remyelination).
Mason et al. 2001 8 week old
Feeding of 0.2% cuprizone
Long-term feeding induced episodic de- and remyelination (intrinsic
up to 16 weeks or for 6
remyelination at weeks 6 and 12); cuprizone feeding decreased axon
weeks followed by normal
diameter & thickness of myelin sheaths. 67% myelinated axons present
food up to 6 weeks
at recovery week 4; average diameter of myelinated axons increased; myelin sheaths of remyelinated axons thinner than controls, high number of unmyelinated small caliber axons after recovery.
McMahon et 2001 8-10 week old
Feeding of 0.2% cuprizone
Several cytokines up-regulated upon demyelination (TNF-α & IL-1β),
MIP-1α and its receptor CCR-5 peaked in weeks 4-5.
MIP-1α-/- mice: Delayed onset of demyelination in the CC (LFB; EM)
correlated with a decreased number of astrocytes and microglia/ macrophages (RCA-1) in the CC; TNF-α level decreased.
Mason et al. 2001 8 week old
Feeding of 0.2% cuprizone
During demyelination: IL-1β/IGF-1-mRNA upregulation in wild-type
Suggests role for
for 6 weeks followed by
mice; mainly microglia express IL-1β & astrocytes IGF-1 (still elevated
IL-1β & IGF-1 in
normal food for 6 weeks
during remyelination).
IL-1β-/- mice: Demyelination including depletion of mature and
accumulation of precursor oligodendrocytes. Impaired remyelination:
Decreased number of remyelinated axons & mature oligodendrocytes. NG2+ cells still elevated. No IGF-1+ cells detected in CC.
2001 6-8 week old
Feeding of 0.2% cuprizone
TNFα upregulated during demyelination in wild-type mice; TNFα+ cells
Suggests role of
for 6 weeks followed by
co-localized with microglia (RCA-1) & astrocytes; TNFR2 but not
TNFα-/-, TNFR1-/-&
normal food for 4 weeks
TNFR1 upregulated during de-/remyelination.
TNFα-/- mice: Delayed demyelination (LFB/GST-pi). TNFα-/- & TNFR2-/-
mice: Impaired remyelination, reduced NG2+/BrdU+ cells during
demyelination; myelinated axons (EM), GST-pi+ & NG2+ cells
decreased upon remyelination. No changes in TNFR1-/- mice.
2003 10 week old
Feeding of 0.2% or 0.4%
In 3rd week: all mice switched to 0.2% cuprizone due to the severe
cuprizone for 5 weeks
effect of 0.4% cuprizone. Caudal part of CC more susceptible to
followed by normal food for 2
demyelination; cerebellar peduncle not affected. 2 weeks recovery: No
change in G-ratio, relation of axon diameter & myelin sheath thickness
not conclusive, swollen dystrophic axons present. High variability of all
parameters even in control mice.
Mason et al. 2004 8 week old
Feeding of 0.2% cuprizone
Chronic demyelination in CC: Ongoing apoptosis of oligodendrocytes;
up to 16 weeks or for 5
little intrinsic remyelination; progenitor oligodendrocytes (NG2)
weeks followed by normal
increased in weeks 4-5, became progressively depleted until week 12.
food for 6 weeks
Peak of microglia/macrophages (RCA-1) at week 6, remained elevated
afterwards. Transplantation of O4+ oligodendrocyte progenitors at week
(Transplantation of O4+ cells)
12: increased number of myelinated axons & mature oligodendrocytes.
2005 7-8 week old
Feeding of 0.2% cuprizone
Week 6 of cuprizone: Demyelination (LFB, EM); G-ratio increased,
for 6 weeks followed by 6
acute axonal damage (APP), astrocytes & microglia (Mac-3) increased.
weeks recovery with normal
6 weeks recovery: G-ratio & astrocytes still elevated, microglia reduced.
MRI analyses: The individual parameters T1 & T2 correlated with EM
myelin status in
data. To differentiate regions of de-/remyelination, a discriminate
function analysis using a combination of T1, T2 & MTR is necessary.
2006 8-10 week & 6-7
Feeding of 0.2% cuprizone
Demyelination similarly distributed within the CC in both age groups but
for 6 weeks (young mice) &
marginally greater in young mice; evidence of intrinsic remyelination in
0.4% cuprizone for 7 weeks
young but not old mice. More severe axonal degeneration (SMI32 &
(old mice) followed by 6 or 7
EM) in aged mice. Significant loss of axons in aged mice at 7 & 14
weeks on normal diet
weeks. Higher number of microglia (CD11b) & astrocytes in old mice.
2006 8-14 week old
Feeding of 0.25% cuprizone
Increased iNOS & nNOS-mRNA levels in wild-type mice. nNOS-/- vs.
C57BL/6, nNOS-/-
for 4 weeks followed by 4
wild-type mice: Minor demyelination but slower remyelination; only
constitutive NOS
weeks recovery with normal
slightly increased number of microglia (RCA-1), astrocytes, apoptotic
cells; decreased NG2+ cells; decreased secretion of TNFα, IL-1β, IGF-1
& iNOS by cuprizone. eNOS-/- mice: Demyelination & cellular changes
comparable to wild-type mice; only slightly delayed remyelination & reduced IGF-1 expression in cuprizone week 4.
Feeding of 0.2% cuprizone
Poorer recovery after chronic vs. acute demyelination in C57BL/6 mice;
Characterization
for 6 or 12 weeks followed by
density of mature (PLP) & precursor (PDGFRα) oligodendrocytes
normal food for 6 weeks
severely decreased; compromised but continued precursor proliferation
at week 12. FGF2 upregulated upon demyelination.
FGF2-/- or FGF2+/+
FGF2-/- mice susceptible to cuprizone-induced demyelination; better
(129 Sv-Ev:Black
recovery rate compared to control mice; oligodendrocyte number
Suggests role of
Swiss) male mice
returned to control levels after 6 weeks recovery. Number of precursor
oligodendrocytes & proliferating cells not affected.
Feeding of 0.2% cuprizone
IFNγ had no effect on demyelination but remyelination in the CC: Lower Induction of high
DOX+(+doxycycline) up to 6 weeks followed by
number of APC+ cells, remyelinated axons & reduced myelin score,
DOX- (-doxycycline)
normal food for 3 weeks
altered time course of NG2+ cell recruitment. Failure of remyelination
(GFAP/tTA;TRE/IFNγ)
associated with activation of the stress pathway of the endoplasmic
2006 8-14 week old
Feeding of 0.25% cuprizone
Increased IFNγ expression level during cuprizone feeding in wild-type
Role of IFNγ in
for 6 weeks followed by
mice. IFNγR-/- vs. wild-type mice: Demyelination slightly delayed (LFB)
contrast to study
IFNγR-/- male mice normal food for 4 weeks
but comparable at week 6; more myelinated axons at week 4, GST-pi+
cells higher at week 6; NG2+ cells peaked at week 3 but higher; delayed accumulation of microglia (RCA-1) until week 4; astrocyte number comparable; TNFα & IGF-1 increased (but less) during demyelination; faster remyelination.
Feeding of 0.2% cuprizone
Increased cell number in demyelinated CC (peak at week 4.5); majority
Characterization
up to 6 weeks followed by
identified as parenchymal microglia (CD11b+/CD45dim), only few blood
normal food for 3 weeks
derived macrophages (CD45high). Majority of cells show activation profile response to
(B7.2/CD86, B7.1/CD80, MHC class I). A subpopulation of CD11c+
microglia/macrophages identified as antigen-presenting cells restricted to the demyelinated CC, higher activation level. Microglia expansion in CC by proliferation in CC and migration from blood stream.
Feeding of 0.2% or 0.3%
Demyelination in CC incomplete by 0.2% & complete by 0.3% cuprizone Focus on early
cuprizone for 6 weeks
at week 6. 0.3%cuprizone: G-ratio increased, percentage of myelinated
followed by normal food for
axons decreased in weeks 4-6; fast remyelination started at day 4,
10 weeks (just 0.3%
almost complete at week 2 (LFB). Different re-expression pattern during
cuprizone-treated mice)
remyelination of PLP, CNPase, MBP & MOG. Recovery rate highest in weeks 1-2 of remyelination phase.
2008 8-10 week old
Feeding of 0.2% cuprizone
Slight upregulation of TNF-like weak inducer of apoptosis (TWEAK) &
for up to 6 weeks followed by
its receptor Fn14 during demyelination in wild-types. TWEAK-/- mice:
normal food up to 8 weeks
Slightly delayed demyelination (LFB, MBP) & accumulation of
microglia/macrophages (RCA-1). No effect on astrocytes.
2009 8 week old PLP-
Feeding of 0.2% cuprizone
Gradual demyelination (CC) from weeks 1.5 to 6 (MOG); remyelination
to normal levels in 1.5+3w & 3+6w group but incomplete in 6+6w group.
- 1.5 weeks + 3 weeks
Increase of precursor (PDGFRα) & decrease of mature (GST-pi)
oligodendrocytes during demyelination, back to control levels in all
remyelination groups. Microglia (CD45) increased during de- &
remyelination. Astrocytes increased during demyelination & even higher
upon remyelination. Functional axon damage in CC: Impaired
amplitude, latency & refractoriness of compound action potentials even after remyelination (3+6w, 6+6w). Nodal protein disorganization & increased axonal damage (APP) at weeks 3 & 6 of demyelination & after remyelination (3+6w, 6+6w). Reduced G-ratio at all time points of demyelination & in 6+6w remyelination group.
Feeding of 0.2% cuprizone
Regional differences in grey & white matter: Delayed demyelination in
grey matter; all cell types analyzed less present & responsive in cortex
than in CC; pattern of oligodendrocytes (Nogo-A, NG2) & astrocytes
similar during demyelination; little microgliosis (Mac-3) in cortex; Peak of Nestin+/GFAP+ cells at week 4 decline thereafter, increased number of proliferating cells mainly Ki67+/Mac-3+ (for both: CC more pronounced).
Feeding of 0.2% cuprizone
Demyelination of the CC at 6-12 weeks. 12 week cuprizone feeding:
Reduced remyelination rate in weeks 1-2 of recovery, almost complete
at the end of recovery. Data about mature (Nogo-A) oligodendrocytes
inconclusive. Start of astrocyte accumulation at week 4, stayed constant
- 12 weeks + 12 weeks
until the end of recovery (acute & chronic model). Peak of microglia
(Mac-3) accumulation at week 6, decreased thereafter (acute &
- 14 or 16 weeks + 4 weeks
chronic). Peak of acute axonal damage (APP) in weeks 4-6 and
remained elevated (chronic). Correlation of microglia and APP+ axon number. SMI-32 present at week 8, most prominent at week 16 of chronic demyelination, not decreased during recovery.
2010 8-10 week old
Feeding of 0.2% cuprizone
Cxcr2-/- mice: relatively resistant to cuprizone toxicity; decrease of
Cxcr2-/-, Cxcr2+/+ &
for up to 6 weeks
mRNA levels of oligodendrocytes, only moderate loss of mature (GST-
pi) & progenitor (PDGFRα) oligodendrocytes, no apoptosis; Cxcr2-
positive neutrophils from bloodstream identified to be necessary for
cuprizone-induced demyelination.
Feeding of 0.2% cuprizone
Peak of microglia (RCA-1) at week 3 in CC & cortex; new cell
Role of microglia
for 5 weeks followed by
population with macrophage expression pattern appeared in CC.
further analyzed
normal food for 1 week
Increased phagocytic activity of microglia during demyelination,
receptors involved in phagocytosis upregulated, especially TREM-2b. MHCII increased at peak of demyelination; TNFα; FGF-2, IGF-1 increased during demyelination
Analysis in the hippocampus, cortex and cerebellum
Hoffmann et 2008 8 week old
Feeding of 0.2% cuprizone
Cuprizone-treated mice: Startle-induced generalized tonic-clonic
for up to 12 weeks followed
seizures present (not visible in EEG). During 9 days after 12 weeks
by normal food for 5 weeks
cuprizone, short but frequent spike discharges recorded (not associated
with behavioral changes). Marked demyelination (PLP) & degenerated neurons (H&E, Fluoro-Jade C) in the hippocampus. Reduced neuron number & density in the hilus, 5 weeks after 12 weeks cuprizone.
2009 8 week & 6 month
Feeding of 0.2% (young
Characterization of grey & white matter demyelination in hippocampus:
old C57BL/6 male
mice) or 0.4% (old mice)
Grey (hilus of dentate gyrus, stratum lacunosum moleculare) & white
cuprizone for up to 7 weeks
matter (medial part of the alveus & dorsal hippocampal commissure) demyelinated by week 7 (LFB, PLP & CC-1, EM). MBP & PLP mRNA expression decreased upon demyelination. Increased number of hypertrophic astrocytes in grey matter. Microglia (Iba1) number not changed. Effects the same in old cuprizone-fed mice.
Koutsoudaki 2009 8 week old
Feeding of 0.2% cuprizone
Complete demyelination (PLP, Nogo-A) of the hippocampus until week
for up to 6 weeks
6 (SLM, fimbria not affected); no change in precursor oligodendrocytes
(NG2); accumulation of microglia (Mac-3) & astrocytes in most regions in weeks 3-4.5, declined thereafter. Nestin+ cells upregulated upon cuprizone, 70% of these cells are GFAP+. PSA expression (migration marker) reduced upon cuprizone.
Skripuletz et 2008 8 week old
Feeding of 0.2% cuprizone
Complete cortical demyelination of C57BL/6 but not BALB/cJ mice after
for up to 6 or 12 weeks
6 & 12 weeks of cuprizone; complete remyelination after 6 or 12 weeks
followed by normal food for 6
recovery but delayed remyelination in 12 weeks cuprizone-fed mice.
Demyelination more severe than in CC; increased number of microglia
(only in BALB/cJ mice). Increased hypertrophic astrocytes in both
strains during demyelination and slow decline during remyelination.
Feeding of 0.2% cuprizone
Demyelination (PLP, PLP-mRNA, MBP-mRNA) & reduced number of
Demyelination in
mature oligodendrocytes (CC-1) in the cerebellar marrow incl. the
lateral cerebellar nucleus, medial cerebellar nucleus, interpositus
nucleus. Increased number of hypertrophic astrocytes & microglia (Iba1) regions at week 5. Cortical cerebellar white matter not demyelinated but myelin sheaths swollen. Cortical cerebellar grey matter not affected.
Skripuletz et 2010 8 week old
Feeding of 0.2% cuprizone
Peak of cerebellar grey & white matter demyelination at week 12;
for 12 weeks followed by
incomplete remyelination by week 8. Lowest level of oligodendrocytes
normal food for 8 weeks
(Nogo-A) at weeks 4 & 12, back to control levels after remyelination.
Mac-3+ cells increased (more prominent in white than grey matter) & peaked at week 6 (grey matter) & weeks 8-10 (white matter); peak of astrocytes at week 8, declined afterwards.
Consequences of cuprizone-induced demyelination on a behavioral and cognitive
level are not studied intensively. So far, impaired motor coordination in a complex
running wheel, impaired social behavior and sensorimotor function, reduced anxiety
and impaired spatial working memory are described (Franco-Pons et al, 2007;
Hibbits et al, 2009; Liebetanz & Merkler, 2006; Makinodan et al, 2009; Xu et al,
2009). Some of these disturbances are shown to be recovered during remyelination
(Franco-Pons et al, 2007; Hibbits et al, 2009; Liebetanz & Merkler, 2006; Makinodan
et al, 2009). Please see Table 3.
The underlying mechanism of the action of cuprizone to induce demyelination is still
under debate. The initial hypothesis was that a copper deficit in the central nervous
system leads to disturbed mitochondrial enzyme function, such as for monoamine
oxidase and cytochrome oxidase (Venturini, 1973). The idea of a copper deficit is
supported by the finding that cuprizone and the cuprizone-copper complex cross
neither the intestinal epithelium nor cell membranes and was therefore suggested to
chelate copper already in the food to induce a copper deficit in mice (Benetti et al,
2010). A recent study, using proteomic analysis, demonstrated that mitochondrial
function is the most altered cellular function induced by cuprizone (Werner et al,
2010), which may result by abnormal concentrations of copper and zinc (Benetti et al,
2010; Zatta et al, 2005). However, neither a deficit of copper in the brain could be
shown by others (Zatta et al, 2005), nor did supplementation of copper to the diet
inhibit the cuprizone-induced toxicity (Carlton, 1966; Carlton, 1967). Therefore, the
action of cuprizone may involve a more complex mechanism. In vitro studies showed
that application of cuprizone to primary oligodendrocytes results in metabolic stress
without cell death unless cuprizone is applied together with inflammatory cytokines,
suggesting that inflammatory mediators play a role in the cuprizone-induced toxicity
(Cammer, 1999; Pasquini et al, 2007). So far, several in vivo studies have been
conducted to investigate underlying mechanisms of cuprizone-induced de- and
remyelination processes. These studies suggest a role for cytokines such as tumor
necrosis factor alpha (TNFα), Interferon-gamma (IFN-γ), Interleukin-1ß (IL-1ß) and
macrophage-inflammatory protein-1 alpha (MIP-1α) (Arnett et al, 2001; Gao et al,
2000; Iocca et al, 2008; Lin et al, 2006; Mana et al, 2006; Mason et al, 2001b;
McMahon et al, 2001). Moreover, a role for nitric oxide and growth factors such as
fibroblast-growth-factor 2 (FGF2) and insulin-like growth factor 1 (IGF-1) is under
discussion (Armstrong et al, 2006; Linares et al, 2006; Mason et al, 2001b). Recently
it was found that type 2 CXC chemokine receptor-positive (CXCR2+) neutrophils from
the bloodstream are necessary for cuprizone-induced demyelination (Liu et al, 2010).
These investigators suggest a two-hit process of cuprizone intoxication: First
oligodendrocytes and second, peripheral CXCR2+-neutrophils are needed to induce
To this day, the knowledge about the mechanism of cuprizone-induced demyelination
has increased, but the process is still not completely understood. Moreover, it is still
questionable why oligodendrocytes are preferentially affected by cuprizone.
Table 3: Effect of cuprizone on basic behavioral and cognitive readouts.
Experimental set-up
Feeding of 0.2% cuprizone
MOSS test performance obtained on a training and complex wheel.
Introduced novel
for 6 weeks followed by 7
Training wheel: Significantly lower running distance of cuprizone-fed
weeks with normal food.
mice over 2 weeks; complex wheel: Influence of all parameters (Vmax,
Motor skill sequence
Nrun, Dmax, Distac) worse performance of cuprizone-fed mice vs.
(MOSS) test performed in
controls during demyelination.
weeks 4-6 of demyelination
Remyelination phase: Comparable performance of cuprizone and
and weeks 5-7 of
control mice except for a reduced Vmax.
Feeding of 0.2% cuprizone
Hyperactive behavior in weeks 3-4 (climbing, center-area activity &
C57BL/6 male mice for up to 6 weeks followed
rearing in open field), increased sensorimotor reactivity (freezing as
by normal food for 6 weeks response to an auditory click) & motor dysfunction at week 5 (gait
abnormalities, higher frequency of falling on rota-rod); hyperactivity & motor deficits still present in recovery group.
2009 7-8 week old
Feeding of 0.2% cuprizone
Temporal pattern of higher climbing activity (weeks 2-4), abnormalities
C57BL/6 male mice for up to 6 weeks
in sensorimotor function (pre-pulse-inhibition: lower PPI in cuprizone-fed schizophrenia
mice in weeks 2-3), impaired social behavior (social interaction in pairs:
reduced in weeks 4-6), lower anxiety levels (EPM: cuprizone-fed mice
spent more time in open arm & higher open arm entries in weeks 2-6) &
impaired spatial working memory (Y-maze: lower % of spontaneous
alternations in weeks 2-6). Reduced enzyme activity (MAO, DBH) at
week 3 in PFC & hippocampus, higher dopamine levels at week 2,
lower norepinephrine levels at week 3.
2009 8-9 week old
Feeding of 0.2% cuprizone
Acute & chronic demyelination: reduced running velocity in the complex
C57BL/6 male mice either for 6 or 12 weeks; 6
wheel not recovered by remyelination. Wheel test applicable for
weeks feeding followed by
longitudinal studies. Frequency of interactive behavior of test mice
normal food for 6 weeks
increased after acute & chronic demyelination & remyelination.
2009 Postnatal day 29 or
Feeding of 0.2% cuprizone
Impaired spatial working memory (Y-maze; lower % of spontaneous
57 C57BL/6 female
from P29-P56 (ED) or P57-
alternations) directly after cuprizone termination in ED/LD mice & after
P84 (LD) followed by
remyelination in ED mice. After remyelination: Reduced distance
normal food up to day
traveled in the center (open field) & disturbed social interaction of ED
mice. No effects in EPM or novel object recognition.
Many studies still focus on characterization of the cuprizone model to better
understand the mechanism of de- and remyelination, as well as the involvement of
the different cell types such as microglia and astrocytes. Moreover, the model has
been used to develop a new magnetic resonance imaging (MRI) method to predict
myelin status in vivo (Merkler et al, 2005). As outlined below, the model is
additionally used for investigations of treatment strategies concerning de- and
1.2.3 Cuprizone model and treatment strategies
The cuprizone model serves as a tool to investigate treatment strategies for
demyelinating diseases such as MS (for an overview see Table 4). Fumaric acid
esters (FAE) are considered for the treatment of patients with relapsing-remitting MS.
The corticosteroid methylprednisolone (MP) is an established and commonly used
drug for MS; both drugs were tested in the cuprizone model. Unfortunately, no effects
were found in oligodendrocytes, microglia or astrocytes; only minor-effects were
found on remyelination upon FAE treatment with even a slight delay in remyelination
by MP treatment (Clarner et al, 2011; Moharregh-Khiabani et al, 2010).
Minocycline, a second generation tetracycline, reduced the severity of demyelination
in corpus callosum and cortex. Additionally, microglia and proliferating cells were
decreased in the cortex, whereas a reduced micoglial number in the corpus callosum
was observed in just one of the studies. Some contradictory results concerning the
corpus callosum in these studies could be based on a slightly different treatment
protocols and different microglia markers used (Pasquini et al, 2007; Skripuletz et al,
2010a). Improved motor coordination of minocycline treated mice was found using
the beam walking test (Skripuletz et al, 2010b).
Sex hormones are suggested to have an effect on disease progression in MS.
cuprizone-induced
demyelination reduced ventricle enlargement and demyelination and increased the
number of mature and precursor oligodendrocytes, microglia, astrocytes and
proliferating cells. The expression of IGF-1 was increased (Acs et al, 2009). No effect
was found when the mice were treated with only one of the hormones. However,
another trial using a lower dose of cuprizone and a higher dose of 17β-estradiol
demonstrated reduced demyelination, increased number of oligodendrocytes and a
delayed accumulation of microglia. Precursor oligodendrocytes and astrocytes were
not affected and IGF-1 and TNFα were decreased, representing different effects of
combined or single treatment of these hormones (Taylor et al, 2010). Based on the
geographic distribution of MS, one could assume that nutrients and the climate can
play a role in the disease mechanism. Supplementation of the cuprizone diet with N-3
polysaturated fatty acids from salmon reduced the demyelination rate and the
number of microglia in the corpus callosum. These mice showed an elevated activity
level and were less anxious (Torkildsen et al, 2009a; Torkildsen et al, 2009b). In
addition, high dose vitamin D3 was found to be potent in reducing demyelination and
microglia accumulation after 6 weeks cuprizone feeding; no effects could be detected
after 2 weeks of recovery (Wergeland et al, 2011).
Thyroid hormones are necessary for normal axonal myelination. Treatment with
triiodothyronine (T3) after chronic demyelination resulted in gradually improved
myelination, increased numbers of mature/precursor oligodendrocytes and
proliferating cells upon recovery (Harsan et al, 2008).
Growth factors are shown to promote oligodendrocyte precursor proliferation, survival
and/or differentiation. A growth factor mix of PDGF-AA, neurotrophin-3, basic FGF-1
and IGF-1 was applied into the lateral ventricle 3 weeks after cuprizone feeding,
which was followed by improved remyelination, activation of oligodendrocyte
precursor proliferation and maturation (Kumar et al, 2007).
Based on the behavioral changes observed during cuprizone feeding and
accumulating findings of white matter abnormalities in schizophrenia (Kubicki et al,
2005; Lim et al, 1999; Mitelman et al, 2007; Uranova et al, 2011), the cuprizone
model was suggested to serve as an animal model to study this disease (Yang et al,
2009). Quetiapine, clozapine and olanzapine (second generation antipsychotics) and
haloperidol (a first generation antipsychotic) were tested in the cuprizone model.
When these drugs were given during the recovery phase, there was no effect on the
status of myelin but rather enhanced performance in working memory (Xu et al,
2011). Administration of the antipsychotics during cuprizone feeding increased the
degree of myelination (Chandran et al, 2011; Xiao et al, 2008; Xu et al, 2010; Zhang
et al, 2008) and the number of mature oligodendrocytes was elevated, whereas the
number of microglia and astrocytes were decreased within the corpus callosum
(Zhang et al, 2008). Quetiapine and clozapine improved spatial working memory and
social interaction in the cuprizone-fed mice (Xiao et al, 2008; Xu et al, 2010).
Haloperidol itself already influenced the performance in some of the behavior tests in
healthy mice, which made it difficult to draw strong conclusions from these
experiments. The results of these studies are presented in Table 5.
Table 4: The cuprizone model and treatment trials related to multiple sclerosis. Antibodies and/or methods used are given in brackets.
Experimental set-up
Feeding of 0.2% cuprizone for 5 weeks
Only a minor effect of monomethylfumarate on remyelination in the CC
combined with oral treatment of
but not cortex in weeks 5-6 (LFB, PLP, MOG, MBP). No effects on
monomethylfumarate or dimethylfumaric
oligodendrocytes, microglia or axonal damage.
acid (15mg/kg) twice daily followed by normal food for 1 week.
Feeding of 0.2% cuprizone for 5 weeks
Early (day 9) and late (day 21) during recovery, methylprednisolone
followed by normal food for 9 or 21 days
treatment reduced myelination index (PLP) compared to placebo-treated
combined with daily injections (i.p.) of
mice. Mature oligodendrocytes (APC), microglia (Iba1) & astrocytes not
methylprednisolone (15mg/kg).
Feeding of 0.2% cuprizone for 5 weeks
No effect of progesterone & 17β-estradiol alone.
combined with s.c. depot injections of
Both hormones together: Reduced ventricle enlargement (MRI) and
progesterone (25µg), 17β-estradiol
demyelination in CC (LFB, mRNA: MBP, PLP), increased number of
(50ng) or a mixture of both twice weekly. mature/precursor oligodendrocytes (APC/PDGFRα), microglia (Iba1),
proliferating cells (Ki67) & the mRNA expression of GFAP (astrocytes). IGF-1 expression also increased.
Feeding of 0.125% cuprizone up to 6
Demyelination in CC (LFB) less severe & higher number of mature
weeks followed by normal food for 1
oligodendrocytes (GST-pi) at weeks 3 & 5 of demyelination. No effect on
week. 17β-estradiol (0.42mg/day)
precursor oligodendrocytes & astrocytes; delayed microglia
pellets were implanted s.c. 5 days prior
accumulation (RCA-1); reduction of TNFα & IGF-1 expression at weeks
cuprizone feeding.
3 & 5 of demyelination. No effect on remyelination.
Feeding of 0.2% cuprizone for 5 weeks.
Demyelination (LFB, MBP) in CC less pronounced after 5 weeks
Feeding was combined in the 2nd week
cuprizone. Number of microglia (CD11b) significantly reduced within the
with injections (i.p.) of minocycline (50
mg/kg twice daily at days 1-2; daily at days 3-7 & 25 mg/kg daily until the end of experiment).
Feeding of 0.2% cuprizone for 6 weeks
Less severe demyelination by minocycline treatment in the cortex in
combined with injections (i.p.) of
weeks 5-6 & in the CC in weeks 4-5 (PLP,MBP,CNPase). No effect on
minocycline (50 mg/kg twice daily at
myelin re-expression; no effect on mature (Nogo-A) or precursor (NG2)
days 1-2; daily at days 3-7 & 25 mg/kg
oligodendrocytes & astrocytes in cortex & CC; decreased microglia
daily until the end of experiment).
number (Mac-3, RCA-1) & proliferation (Ki67) at week 5 in cortex but not CC. Improved motor coordination (beam walking) in weeks 5-6.
Feeding of mice with the same food but
Salmon/cuprizone group: Reduced volume of hyperintense brain lesions
supplemented with different lipid
measured in T2-weighted MRI images (correlated with increased water
sources (salmon, cod liver, soybean &
content in brain parenchyma) at cuprizone week 5; demyelination (LFB,
olive oils). At 8 weeks of age 0.2%
PLP) of the CC less severe at week 6 & after 1 week recovery. Lowest
cuprizone was added to the food for 6
number of microglia in CC at week 6 but no group differences after
weeks followed by 1 week without
recovery. Soybean oil/cuprizone group: Tendency to improve
remyelination. No effect on astrocytes in any group. BBB not disrupted.
Feeding of mice with the same food but
Salmon/cuprizone group: Confirmed their previous finding of reduced
supplemented with different lipid
demyelination. New: Less body weight loss and increased activity levels
sources (salmon, cod liver, soybean &
in the EPM, visits of open and closed arm increased without a
olive oils). At 8 weeks of age 0.2%
preference to either of them (less anxious).
cuprizone was added to the food for 6 weeks.
Feeding with food containing <50 IU/kg,
Serum levels of vitamin D3 increased or deceased according to the
500 IU/kg, 6200 IU/kg or 12500 IU/kg
feeding. High dose of vitamin D3: Decreased demyelination in the CC, no
vitamin D3. After 2 weeks, diets were
influence on remyelination (LFB, PLP); depletion of mature
supplemented with 0.2% cuprizone for 6
oligodendrocytes (Nogo-A) not influenced; reduced microglia
weeks followed by 2 weeks without
accumulation (Mac-3) in CC. 2 weeks after recovery microglia further
decreased in all groups, significantly only by low dose vitamin D3.
Feeding of 0.2% cuprizone for 12 weeks
Hyperthyroidism 3 weeks after treatment started but transient at week 6.
followed by normal food for 12 weeks +/- T3-effects: DTI: Fractional anisotropy back to normal levels at week 12 in
triiodothyronine hormone (T3; 0.3µg/g
all ROIs (e.g. genu, splenium & cerebellum); radial diffusivity gradually
body weight) daily for 3 weeks (i.p.).
decreased, reached normal levels until week 3 (cerebellum), 6 (splenium) or 12 (genu). Gradual increase of carbonic anhydrase II+- oligodendrocytes & MBP in the CC/cerebellum (weeks 3-12 of recovery) Higher number of Olig2+, Shh+, NG2+ & proliferating cells from week 3 on, gradual decrease of CD45+ microglia & increase of myelinated axons.
Feeding of 0.2% cuprizone for 3 weeks
2-5 days post injection (dpi): Increased cell proliferation & migration in
followed by normal food + a single
CC, rostral migratory stream, cortex & striatum in wild-type & cuprizone-
injection of a growth factor mix (PDGF-
fed mice; proliferating cells identified as GFAP+ & NG2+ cells.
AA, NT3, bFGF,IGF-1) into the lateral
NG2+/BrdU+ cells partially differentiated into mature oligodendrocytes
(GST-pi). More myelinated fibers & thicker myelin sheaths in growth
factor-treated cuprizone mice 21 dpi. Increased apoptosis in wild-type and cuprizone mice upon growth factor treatment.
Table 5: The cuprizone model and treatment trials related to schizophrenia. Antibodies and/or methods used are given in brackets.
Experimental set-up
Feeding of normal chow for 1 week
Prevention of myelin breakdown (MBP) in whole brain (especially cortex)
followed by feeding with 0.2% cuprizone
and improvement of spatial working memory (Y-maze: spontaneous
for 4 weeks. Quetiapine (10mg/kg/day)
alternation, arm entries).
via drinking water over all 5 weeks.
Treatment with quetiapine
Elevated degree of myelination (LFB,MBP IHC&WB) quantified in whole
(10mg/kg/day) for 6 weeks via drinking
brain & GST-pi+ oligodendrocytes in CC by quetiapine. Decreased
water; feeding of 0.2% cuprizone started
activity of superoxide dismutase 1 in the cortex of cuprizone mice and
after 1st week of quetiapine treatment for back to normal levels upon quetiapine treatment. Decreased number of 5 weeks.
CD11b+ microglia & GFAP+ astrocytes in CC.
Feeding of 0.2% cuprizone for 14-42
All antipsychotics blocked cuprizone-induced PPI deficit & reduced
days combined with daily injections
cuprizone-induced levels of dopamine & norepinephrine in PFC (day14).
(i.p.) of haloperidol (1mg/kg), clozapine
Clozapine & quetiapine counteracted cuprizone-induced decrease in
or quetiapine (10mg/kg).
spontaneous alternation in Y-maze & impaired social interaction (day28). & social
Clozapine & haloperidol increased myelination in PFC; clozapine &
quetiapine in caudate putamen (day 43; MBP, WB).
Feeding of 0.2% cuprizone for 5 weeks
Cuprizone feeding influenced the performance in EPM (increased time in Haloperidol
followed by normal food for 3 weeks
open arm), reduced social interaction & spatial working memory of mice.
combined with daily injections (i.p.) of
Fast spontaneous recovery within 14-21 days concerning EPM but
clozapine or quetiapine (10mg/kg),
social interaction & spatial working memory still reduced. Only clozapine, interaction &
haloperidol (1mg/kg) or olanzapine
quetiapine & olanzapine promoted the recovery of spatial working
memory. No effect of antipsychotics on other tests or the myelin status.
Feeding of normal chow for 1 week
T2-weighted MRI images: Significant decrease in the signal intensity
followed by 0.2% cuprizone for 5 weeks.
ratio counteracted by quetiapine. DTI: fractional anisotropy levels back
Quetiapine (10mg/kg) was administered
to control levels under quetiapine treatment. Optical density of LFB &
via drinking water during the 6 weeks.
MBP significantly elevated by quetiapine.
1.3 Erythropoietin
1.3.1 Properties and pathways
EPO is a hematopoietic growth factor regulating the survival, proliferation and
differentiation of erythroid progenitor cells (Jelkmann, 1992; Klingmuller, 1997). In
1977, the human EPO molecule was purified from urine, opening the possibility for its
characterization (Miyake et al, 1977). EPO is a 30.4 kDa glycoprotein which belongs
to the class I cytokine superfamily and is mainly expressed in the fetal liver and adult
kidney (Dame et al, 1998; Fried, 1972; Koury et al, 1988; Zanjani et al, 1977).
Additionally, EPO is identified to be expressed in the brain (Bernaudin et al, 1999;
Marti, 2004; Marti et al, 1996; Masuda et al, 1994). The expression of EPO and the
EPO receptor (EPOR) peaks during mid-gestation, whereas both are expressed in
low levels during adulthood (Juul et al, 1998; Liu et al, 1994; Siren et al, 2001).
However, in both the hematopoietic system and in the brain, EPO expression is
upregulated under hypoxic conditions (Brines & Cerami, 2005; Jelkmann, 2007;
Noguchi et al, 2007; Sasaki et al, 2001; Siren & Ehrenreich, 2001). The importance
of the EPO-EPOR system during normal brain development was shown in EPO and
EPOR null mice. The lack of erythropoiesis led to death of mice at day E13.5. Brain
development was already impaired at day E10.5 (Yu et al, 2002). Mice with a
conditional knockout of the brain EPOR survived through adulthood but showed
reduced neurogenesis (Tsai et al, 2006).
The EPOR is a cell surface receptor and belongs to the cytokine class I receptor
superfamily (Klingmuller, 1997; Youssoufian et al, 1993). These receptors are
characterized by a single hydrophobic transmembrane domain, an extracellular N-
terminal domain with conserved cysteines and a WSXWS-motif and a cytosolic
domain that lacks intrinsic kinase activity (Jelkmann, 2007). The cytoplasmic domain
of the EPOR is associated with the Janus kinase 2 (Jak2). Binding of EPO to the pre-
formed EPOR homodimer activates Jak2, which phosphorylates 8 tyrosines located
in the cytoplasmic domain of EPOR. These serve as docking sites for downstream
molecules, which can become phosphorylated and activate several intracellular
pathways (Jelkmann, 2007). Signaling pathways involved are signal transducers and
activators of transcription (Stat), phosphatidylinositol 3-kinase (PI3K) and ras-
mitogen-activated protein kinase (Ras-MAPK) (Brines & Cerami, 2005; Siren &
Ehrenreich, 2001).
For more than 20 years, EPO has been used to treat patients suffering from anemia
and is therefore accepted as a well tolerated and safe therapy (Jelkmann, 1992).
Some of the first observations of neuroprotective properties of EPO were the
prevention of glutamate-induced neuronal cell death in vitro (Morishita et al, 1997),
anti-apoptotic and neurotrophic effects of EPO after unilateral fimbria-fornix
transection (Konishi et al, 1993) and reduced ischemia-induced neuronal damage
(Sakanaka et al, 1998) in rodents. Ever since, several studies could demonstrate
neuroprotective and neuroregenerative properties of EPO in preclinical and clinical
studies ranging from cerebrovascular diseases and neuroinflammatory diseases to
neurodegeneration (for an extensive review please see (Sargin et al, 2010)). In these
studies, EPO has been shown to be anti-apoptotic, anti-oxidative, anti-inflammatory,
neurotrophic, angiogenetic and stimulate stem cell differentiation (Bartels et al, 2008;
Brines & Cerami, 2005; Byts & Siren, 2009; Chen et al, 2007; Shingo et al, 2001;
Siren & Ehrenreich, 2001). To emphasize that these effects are independent of the
hematopoietic action of EPO, it was important to investigate whether EPO is able to
cross the BBB. Indeed, it has been shown that a small proportion of high doses of
exogenous EPO is able to cross the BBB using biotinylated-EPO in rodents (Brines
et al, 2000) and indium-labeled EPO in healthy subjects and schizophrenic patients
(Ehrenreich et al, 2004). The exact mechanism of how EPO crosses the BBB is not
yet known. Additionally, it is still questionable if the EPOR responsible for the
neuroprotective effect of EPO in the brain is the same as for the hematopoietic
system. Brines and colleagues suggested a heteromeric receptor complex consisting
of one EPOR subunit and one ß-common receptor subunit which belongs to the
interleukin-3 receptor family (Brines et al, 2004). Moreover, the identification of an
EPO analogue with potent neuroprotective but no hematopoietic action is of major
interest for clinical applications.
1.3.2 Erythropoietin and oligodendrocytes
Oligodendrocytes are the myelinating cells in the CNS. They allow fast saltatory
conduction of signals along the axons and more recent investigations show a
supportive function of oligodendrocytes for axon survival (Nave, 2010).
The expression of EPO and EPOR has been found in vitro in astrocytes, neurons,
microglia and oligodendrocytes (Masuda et al, 1994; Morishita et al, 1997; Nagai et
al, 2001; Sugawa et al, 2002). The effect of EPO on oligodendrocytes is not
extensively studied yet. The first who clearly showed the presence of EPO and
EPOR mRNA expression in cultured rat oligodendrocytes were Sugawa and
colleagues (Sugawa et al, 2002). Moreover, they claimed that EPO promotes
differentiation/maturation of oligodendrocytes as shown by direct EPO treatment and
by a co-culture experiment with astrocytes. In this study, the involvement of the
classical EPO pathway Jak2/Stat5 could not be detected. In several different disease
models, EPO has been found to preserve myelin sheaths (Gorio et al, 2002; Iwai et
al, 2010; Kumral et al, 2007; Li et al, 2004; Liu et al, 2011; Vitellaro-Zuccarello et al,
2007; Yamada et al, 2011) and resulted in earlier and faster white matter
reorganization after ischemia shown by MRI (Li et al, 2009). Direct preservation of
oligodendrocytes was observed in a model of neurotrauma (Sargin et al, 2009). A
very consistent finding so far is that EPO enhances proliferation of precursor
oligodendrocytes and increases the maturation of oligodendrocytes, and is therefore
suggested to enhance oligodendrogenesis (Iwai et al, 2010; Vitellaro-Zuccarello et al,
2007; Zhang et al, 2005; Zhang et al, 2010). In models for periventricular
leukomalacia and traumatic spinal cord injury, it was shown that EPO reduced the
apoptosis rate in the white matter (Arishima et al, 2006; Gorio et al, 2002; Kumral et
al, 2007). In vitro, EPO decreased the cytotoxicity in oligodendrocyte cultures after
interferon-γ and lipopolysaccharide or hydrogen peroxide administration (Genc et al,
2006; Mizuno et al, 2008). Furthermore, anti-inflammatory potential of EPO was
shown by a decrease in nitrite production and reduced mRNA expression of inducible
nitric oxide synthase in mature oligodendrocyte cultures, as well as by a reduction of
cytokine levels in the developing rat brain (Genc et al, 2006; Kumral et al, 2007).
Some discrepancies between studies may result from different study designs or
different protocols of EPO application. Further studies are needed to clarify the effect
of EPO on oligodendrocytes and myelin. In addition, this is of special interest
concerning alternative treatment strategies for demyelinating diseases such as MS.
1.4 Scope of the thesis
As outlined above, EPO has been proven to bear neuroprotective and
neuroregenerative properties shown in several disease models. With respect to
oligodendrocytes, EPO is suggested to mainly promote oligodendrogenesis and
preserve myelin under different pathological conditions. It is of major interest to
understand the effect of EPO on oligodendrocytes in more detail concerning
alternative treatment strategies for demyelinating diseases such as MS. In the most
commonly used animal model for MS, experimental autoimmune encephalomyelitis
(EAE), EPO has been shown to delay the disease onset, has immune-modulatory
electrophysiological and histological readouts of EAE ((Agnello et al, 2002; Brines et
al, 2000; Chen et al, 2010; Diem et al, 2005; Kang et al, 2009; Leist et al, 2004; Li et
al, 2004; Sattler et al, 2004; Savino et al, 2006; Thorne et al, 2009; Yuan et al, 2008;
Zhang et al, 2005) and reviewed in (Bartels et al, 2008; Sargin et al, 2010)). The
effect of EPO on demyelination in the EAE model is rarely investigated - so far it has
been shown that EPO reduces demyelination and enhances proliferation of precursor
oligodendrocytes in the central nervous system but not in the optic nerve (Dasgupta
et al, 2011; Diem et al, 2005; Li et al, 2004; Sattler et al, 2004; Zhang et al, 2005).
The aim of this thesis was to make use of the cuprizone mouse model to investigate
the effect of EPO on demyelination and remyelination processes without direct
influence of immune-inflammatory components. This was studied with different
experimental designs:
Effect of EPO on remyelination
In this experimental set-up, the effect of EPO was investigated after a single and
repeated exposure to cuprizone. The idea of repeated cuprizone intoxication was to
apply an additional "demyelination-hit" after a partial recovery. This is related to
disease conditions such as in the relapsing-remitting disease course in MS. EPO
application started in the beginning of the recovery phase and therefore allowed
investigation of the effect of EPO on the remyelination process.
Effect of EPO on demyelination
The experimental design included a single cuprizone exposure followed by a
recovery phase. From weeks 4-6 of cuprizone feeding, EPO was applied to
investigate the effect on demyelination.
immunohistochemical staining, western blot analysis and quantitative RT-PCR. It was
hypothesized that EPO improves cuprizone-induced changes in these readouts. So
far, no study exists to investigate the effect of EPO in the cuprizone mouse model.
2. Materials and Methods
2 MATERIALS AND METHODS
2.1 Animals
All experiments were approved by and conducted in accordance with the regulations
of the local Animal Care and Use Committee (Niedersächsisches Landesamt für
Verbraucherschutz und Lebensmittelsicherheit; AZ 33.11.42502-04-040/08 and AZ
33.9-42502-04-10/0157). 4 week old C57BL/6 male mice were purchased from
Charles River Laboratories (Sulzfeld, Germany) for all experiments. They were
housed in groups of 5 in standard plastic cages and maintained in a temperature-
controlled environment (212°C) on a 12 hour light/dark cycle with food (Sniff, Soest,
Germany) and water available ad libitum. 8 week old C57BL/6 male mice were used
in each experiment if not indicated otherwise. Body weight of mice was monitored
over the whole experimental time. Moreover mice were carefully observed to see any
adverse effects of the treatment.
2.2 Preparation of cuprizone containing food
2.2.1 Food pellets containing 0.2% cuprizone
Food pellets containing 0.2% cuprizone (weight/weight) (Sigma Aldrich, Taufkirchen,
Germany) were customer made by Sniff (Soest, Germany).
2.2.2 Standard ground chow containing 0.2% or 0.3% cuprizone
A plastic container was used to carefully mix standard ground chow (Sniff, Soest,
Germany) with cuprizone. Food was freshly prepared daily. Mice in the control
groups were fed with the regular standard ground chow without cuprizone added.
2.3 Erythropoietin administration
Erythropoietin (NeoRecomon; 50000 IU/ml; Roche, Penzberg, Germany)
was freshly
prepared by dilution with EPREX solvent solution (Pharmacy at the University
hospital, Göttingen, Germany). Mice received a dose of 5000 IU/kg body weight
every other day over a 3 week period. Placebo mice were injected with the diluent of
2. Materials and Methods
2.4 Measurement of the haematocrit
To measure the haematocrit, blood was taken from the heart and collected in EDTA-
coated-tubes (Sarstedt, Nümbrecht, Germany). The blood was taken up by micro-
haematocrit capillaries that were sealed with a kit (Brand, Wertheim, Germany). The
tubes were centrifuged for 10 minutes; 8000 rpm (Heraeus Biofuge haemo; Kendro;
Osterode; Germany). The haematocrit was directly measured on a micro-haematocrit
scale (Kendro, Osterode, Germany).
2.5 Experimental design
2.5.1 Pilot experiments
In the first pilot experiment, mice were divided into two groups (44 mice/group); one
group received normal food pellets and the other food pellets containing 0.2%
cuprizone over a period of 7 weeks (Figure 2). Body weight and motor performance
(2.6.1) of mice was monitored over the whole experimental time.
Figure 2: Experimental scheme of first pilot experiment. N=44/group
In the second pilot experiment, the difference of cuprizone administration via food
pellets and rodent ground chow was tested. Over a period of 19 days, 7 week old
mice (N=3) were exposed to 0.2% or 0.3% cuprizone mixed in rodent ground chow
(Figure 3) and 6 week old mice (N=3) received food pellets containing 0.2%
cuprizone (Figure 4). The body weight was measured over the whole experimental
Figure 3: Experimental scheme of second pilot experiment.
Mice (N=3) received cuprizone mixed into ground chow.
2. Materials and Methods
Figure 4: Experimental scheme of second pilot experiment.
Mice (N=3) received cuprizone via food pellets.
2.5.2 Investigation of EPO on remyelination
2.5.2.1 Single treatment of cuprizone
To investigate the effect of EPO on remyelination after an acute demyelination
phase, a 4-arm design was used (N=20/group). Two groups served as control groups
and received normal ground chow; the other two were fed with 0.2% cuprizone mixed
into ground chow. After 6 weeks all mice were put on normal chow and one control
and one cuprizone group received either placebo or EPO every other day over the
next 3 weeks (Figure 5). Mice were sacrificed and used for protein analysis. During
the experiment rota-rod was performed (see 2.6.1).
Figure 5: Experimental scheme of the single treatment group to
investigate the effect of EPO on remyelination. N=20/group;
i.p.=intra-peritoneal; bw=body weight; EPO=erythropoietin.
2. Materials and Methods
2.5.2.2 Repeated treatment of cuprizone
To investigate the effect of EPO on remyelination after a repeated exposure to
cuprizone, a 4-arm design was used (N=25/group). Two groups served as control
groups and received normal ground chow; the other two were fed with 0.2%
cuprizone mixed into ground chow. After 6 weeks all mice were put on normal chow
and one control and one cuprizone group received either placebo or EPO every other
day over the next 3 weeks. This was followed by a second cycle of cuprizone feeding
over 6 weeks and a second recovery phase for 3 weeks with placebo/EPO injections
as described before (Figure 6). After the second demyelination phase (week 15) and
at the end of the experiment (week 18) mice were tested on the beam balance test
(see 2.6.2). Rota-rod was performed twice weekly during the whole experiment (see
2.6.1). At the end of the experiment (week 18) mice were used for MRI and the
measurement of acoustic evoked potentials (AEPs) and sacrificed afterwards. Brain
samples were used for protein analysis.
Figure 6: Experimental scheme of the repeated treatment group to investigate the effect of EPO on
remyelination. N=25/group; i.p.=intra-peritoneal; bw=body weight; EPO=erythropoietin.
2.5.3 Investigation of EPO on demyelination
To investigate the effect of EPO on demyelination during an acute demyelination
phase, a 4-arm design was used (N=26/group). Two groups received normal ground
chow and the other two were exposed to 0.2% cuprizone over 6 weeks. From weeks
4 to 6 of this period, mice were injected intra-peritoneal (i.p.) with EPO or placebo
(Figure 7). After 6 weeks, 8-11 mice/group were used for MRI and
immunohistochemistry; whereas 15 mice/group received normal chow over the next
3 weeks. At week 9, mice were used for MRI and scarified afterwards. Additionally, at
weeks 6 and 9 the beam balance test and rota-rod was performed (see 2.6).
2. Materials and Methods
Figure 7: Experimental scheme to study the effect of EPO on
demyelination. N= 26/group; i.p.=intra-peritoneal; bw=body weight;
EPO=erythropoietin.
All tests and analyses were performed in a ‘blinded' fashion. The experimenter was
not aware of any group assignment until the end of the experiments.
2.6 Behavioral testing
The group size in the different behavioral experiments is stated in the respective
2.6.1 Rota-rod
Rota-rod is a test for motor function, balance and coordination and comprises a
rotating drum which is either at constant speed or accelerated from a lower to higher
speed over a distinct time period. The protocols used are described before (Carter et
al, 2001) and were modified in our laboratory (e.g. (Radyushkin et al, 2010)). Two
protocols were used in these studies, first rota-rod with a constant speed of 16
resolutions per minute (rpm) and second an accelerated rota-rod of 4-40 rpm. Both
protocols started with a habituation day which involved placing each mouse
individually on the non-rotating drum for 5 minutes. The actual experiment started on
the second day of testing.
2. Materials and Methods
2.6.1.1 Constant rota-rod
In the first pilot experiment, mice were tested twice every week throughout the whole
experimental time. The rota-rod (Ugo Basile, Comerio, Varese, Italy) was set to a
constant speed of 16 rpm and the time mice were able to stay on the rod (falling
latency) was measured. Each mouse had 3 trials per day with an inter-trial interval of
5 minutes. A cut-off time was set to 5 minutes. After each trial, the rotating drum was
cleaned. From week 5 on, all mice were switched to an accelerated rota-rod.
2.6.1.2 Accelerated rota-rod
In all experiments (except the first part of the first pilot experiment) an accelerated
rota-rod protocol was used. The speed increased from 4-40 rpm within 5 minutes.
Mice were placed on the rotating drum and the falling latency was recorded. For the
second part of the first pilot experiment and for the experiment to investigate the
effect of EPO on remyelination, all mice were tested twice every week with one trial
per day over the whole experimental period.
In order for the experiment to investigate the effect of EPO on demyelination, the
mice were first tested at baseline before cuprizone exposure. On the first day after
the habituation, the mice were tested on the accelerated rota-rod (1 trial per day). To
assess motor learning, the test was repeated 24 hours later. At both, week 6 and 9,
the accelerated rota-rod was performed on 3 consecutive days.
2.6.2 Beam balance
Beam balance is a test for motor coordination and vestibulomotor function. The set-
up consists of an elevated beam that has an enclosed escape platform including
bedding on one end. The mice are trained to cross the beam towards the enclosed
escape platform and the latency of mice to cross the beam is recorded (Carter et al,
2001). The protocol used in these studies are based on the common beam walking
protocol but was further modified. All the beams were 59 cm long and varied in their
diameter. The light in the experimental room was dimmed and the start side of the
beam was illuminated. For habituation, a 25 mm diameter beam was used. On the
first day of habituation, the mice were placed right in front of the enclosed escape
platform; when the mouse entered the box they were allowed to stay there for 30
seconds (s). After a 5 minute inter-trial interval, mice were placed in the middle of the
beam and the mice had to walk to and enter the escape box. The mouse was again
2. Materials and Methods
left there for 30 s. On the second day, habituation was performed by first placing the
mouse in the middle of the beam followed by a 5 minute inter-trial interval and then
starting again by placing the mouse at the start of the beam. The mouse then had to
walk again to the escape box and stayed there for 30 s. After the habituation, the
actual test was performed. The beam was exchanged to a 10 mm diameter beam,
the mouse was placed at the start of the beam and the latency to reach the escape
box was measured. On the third day the mice were tested on the 8 mm diameter
beam and the latency to cross the beam was again recorded. If a mouse failed to
stay on the beam, the test was repeated, maximum were 3 trials/mouse. If all trials
failed, a cut-off time of 60 s was set for the analysis of data. This protocol including
an intensive habituation phase was used at week 15 and at baseline to investigate
the effect of EPO on remyelination and on demyelination respectively. At all other
time points the beam balance test was performed on 2 consecutive days; on the first
day a short habituation was applied by placing the mice again in the middle and start
of the 25 mm beam. This was followed by testing the mice on the 10 mm beam. On
the second day the latency to walk across the 8 mm beam was recorded. The same
criteria for non-performer were used as described above. The performance of mice
was calculated by the duration on the beam in % of control.
2.7 Assessment of hearing
2.7.1 Startle response of mice
To control for hearing of mice, a test using the startle response of mice as a
response to acoustic stimuli can be used (Logue et al, 1997).
Each mouse was placed in a small metal cage (90x40x40 mm) to restrict major
movements and exploratory behavior. The cages were equipped with a movable
platform floor attached to a sensor that records vertical movements of the floor. The
cages were placed in four sound-attenuating isolation cabinets (TSE GmbH, Bad
Homburg, Germany). Startle reflexes were evoked by acoustic stimuli delivered from
a loudspeaker that was suspended above the cage and connected to an acoustic
generator. The startle reaction to an acoustic stimulus evokes a movement of the
platform and a transient force results from this movement of the platform. This was
recorded with a computer during a recording window of 100 ms and stored for further
analysis. The recording window was defined from the onset of the acoustic stimulus.
2. Materials and Methods
An experimental session consisted of a 2 minutes habituation to 65 dB background
white noise (continuous throughout the session), followed by a baseline recording for
1 minute at background noise. After baseline recording, stimuli of different intensity
and fixed 40 ms duration were presented. Stimulus intensity was varied between 65
dB and 120 dB, such that 19 intensities from this range were used with 3 dB steps.
Stimuli of each intensity were presented 10 times in a pseudorandom order with an
interval ranging from 8 to 22 s. The amplitude of the startle response (expressed in
arbitrary units; AU) was defined as the difference between the maximum force
detected during a recording window and the force measured immediately before the
stimulus onset. Amplitudes of responses for each stimulus intensity were averaged
for individual animals. Mean values for each experimental group were used for
analysis of the stimulus-response curves.
2.7.2 Recording of auditory brain stem responses (ABRs)
This measurement was done in collaboration with Nicola Strenzke, Department of
Otorhynolaryngology, University hospital, Göttingen, Germany.
Animals were anaesthetized intra-peritoneally with a combination of ketamine (125
mg kg-1) and xylazine
(2.5 mg kg-1) and the heart rate was constantly monitored to
control the depth of anesthesia. The core temperature was maintained constant at
37°C using a rectal temperature-controlled heat blanket (Hugo Sachs Elektronik –
Harvard Apparatus GmbH, March-Hugstetten, Germany). For stimulus generation,
presentation, and data acquisition, the TDT III Systems was used (Tucker-Davis-
Technologies, Ft Lauderdale, FL), run by custom-written Matlab software (The
Mathworks). Clicks of 0.03 ms duration were calibrated using a ¼‟‟ Brüel and Kjaer
microphone (D 4039, Brüel & Kjaer GmbH, Bremen, Germany) and were presented
at 20 and 90 Hertz in the free field ipsilaterally using a JBL 2402 speaker (JBL GmbH
& Co., Neuhofen, Germany). The potential difference between vertex and mastoid
subdermal needles was amplified 20 times and sampled at a rate of 50 kilohertz for
20 ms, 2x2000 times to obtain two mean ABRs for each sound intensity. Hearing
threshold was determined with 10 dB precision as the lowest stimulus intensity that
evoked a reproducible response waveform in both traces by visual inspection.
Amplitudes and latencies of ABR waves I-V (Jewett & Williston, 1971) were analyzed
using a semi-automatic custom-written Matlab routine.
2. Materials and Methods
2.8 MRI analysis
All MRI measurements and the analysis of the %MTR were performed in
collaboration with Susann Boretius, Max Planck institute for biophysical chemistry,
Göttingen, Germany. Volumetrical analysis of the data obtained was done by myself.
2.8.1 MRI measurements
6 mice per group underwent MRI at the time points described above. The animals
were anesthetized with 1-1.5% isoflurane in a mixture of oxygen and ambient air and
positive ventilated via endotracheal tube. The artificial respiration was controlled, by
a homemade sensor placed on the chest of the mice. During the measurements the
mice were fixed at the head and the body temperature (36±1°C) was kept constant
by a rectal temperature-controlled heat blanket. 3D Fast Low-Angle Shot (FLASH)
MRI (TR/TE = 14.9/3.9 ms, 45 minutes each) was performed at 9.4 T (Bruker
Biospin, Ettlingen, Germany) with 110 µm isotropic spatial resolution using a 4-
element phased-array surface coil (Bruker Biospin, Ettlingen, Germany) for signal
reception. 3 data sets were obtained: a T-1 weighted data set with a flip angle of 12°
and 2 proton-density (PD) weighted data sets with a flip angle of 5°. In addition,
magnetization transfer (MT) weighted images were obtained by off-resonance
irradiation (frequency offset 3 kilohertz, Gaussian pulse, duration 3.5 ms, flip angle
135°). The MT weighted data set together with the PD weighted image was used to
calculate the magnetization transfer ratio (MTR) in percentage. %MTR=((PD-
MT)/PD)x100%. To reduce the background noise the images were modified by a mild
Gauß filter (s=1 Pixel, 3x3 Kernel) before. T1 maps were calculated by the T1- and
PD-weighted data sets. In addition, multi-slice T2-weighted images were acquired
with use of a fast spin-echo MRI sequence (TR/TE=5300/64 ms, 8 echoes, 26
sections) at an in-plane resolution of 80 µm and a section thickness of 300 µm
(Boretius et al, 2009).
2.8.2 Volumetrical analysis
The brain volume (total brain, brain matter, hippocampi, ventricles) was determined
by using Amira software (Visage Imaging GmbH, Berlin, Germany). In the T1 maps
every second slice in the transversal layer was analyzed. The different regions were
manually surrounded and labeled by going through the brain from superior to inferior.
The coronal and sagittal layer was always consulted to reliably label the different
2. Materials and Methods
regions. The data obtained by Amira were non-dimensional and only represented the
number of pixel within the regions. One pixel had a volume of 110*110*110 µm,
therefore the data were multiplied by this volume and by 2 (because only every
second brain slice was analyzed).
2.8.3 %MTR
%MTR was calculated pixel by pixel resulting in a 3-dimensional parameter map.
From this MTR-map the corpus callosum as region of interest (ROI) was selected on
a sagittal oriented slice, 4 slices away from the center. The corpus callosum was
divided in 3 parts, rostral, central, and caudal allowing to separate between different
regions within the corpus callosum.
2.9 Staining of mouse brains
2.9.1 Preparation of tissue
Animals were anesthetized with 0.25% tribromoethanol (Avertin; 0.125 mg/g, i.p.;
Sigma Aldrich, Taufkirchen, Germany) and perfused transcardially with Ringer-
solution (Braun, Melsungen, Germany) followed by 4% paraformaldehyde (PFA;
Merck, Darmstadt, Germany). The brain, spinal cord, kidney and liver were removed,
put in 4% PFA and post-fixed overnight at 4°C. On the next day the brains were
placed in 30% sucrose (Merck, Darmstadt, Germany) diluted in phosphate buffered
saline (PBS) for cryoprotection. After dehydration of the brains (2-4 days), the
cerebellum and the brain were separately frozen on liquid nitrogen. The samples
were stored at -80°C. Brains were cut by putting them vertically on a small metal
plate with Tissue-tack (Sakura, Alphen aan den Rijn; Netherlands), surrounded by
the tissue tack and placed in the cryostat (Leica, Wetzlar, Germany). When the tissue
tack was fully frozen the whole mouse brain was cut into 30 µm thick coronal
sections on a cryostat. The sections were kept in a 48 well plate (1 brain slice/well) in
a storage solution (25% ethylene glycol (Sigma Aldrich, Taufkirchen, Germany) and
25% glycerol (Merck, Darmstadt, Germany) in PBS). The plates were stored at -20°C
until the stainings were started.
2. Materials and Methods
2.9.2 Luxol Fast Blue staining
The LFB staining is a fast histological method to visualize myelin. The staining was
The cryostat-sections were washed 4 times 15 minutes in 1xPBS, mounted on
Superfrost plus glass slides (Thermo Fisher Scientific, Braunschweig, Germany) and
dried. Slides were then directly put into a 1:1 alcohol- (Sigma Aldrich, Taufkirchen,
Germany) chloroform solution (Merck, Darmstadt, Germany) over night and hydrated
back to 95% alcohol. On the next day, the slides were put in 0.1% LFB-solution
(Serva, Heidelberg, Germany) containing ethyl alcohol 95% (Sigma Aldrich,
Taufkirchen, Germany) and glacial acetic acid (Merck, Darmstadt, Germany) over
night at 56°C. Slides were first rinsed with 95% ethanol (Sigma Aldrich, Taufkirchen,
Germany) and then with ddH2O. Slides were differentiated for 30 s by 0.05% lithium
carbonate solution in ddH2O (Sigma Aldrich, Taufkirchen, Germany), followed by
70% alcohol for 30 s. Slides were rinsed with ddH2O, dehydrated and coverslipped
using DePeX (Serva, Heidelberg, Germany).
2.9.3 Immunohistochemical staining
For immunohistochemistry, a series of every 10th coronal section through the entire
brain was taken for each marker under investigation. Free floating sections were
washed with 1xPBS for 15 minutes 3 times, mounted on Superfrost plus glass slides
(Thermo Fisher Scientific, Braunschweig, Germany) and dried over night. Slides
were washed for 5 minutes 3 times in 1xPBS and then boiled in citrate buffer for 2
minutes 3 times (1.07 mM citric acid monohydrate and 11.9 mM trisodium citrate
dehydrate; Merck, Darmstadt, Germany). Slides were cooled down in ddH20 for 5
minutes, washed in 1xPBS (for 5 minutes 3 times) and then incubated in 0.5 % H2O2
in ddH2O for 30 minutes. To prevent unspecific binding, the sections were incubated
for 1 hour in a blocking solution containing 5% normal horse serum (Jackson
Immunoresearch, West Grove, USA) and 0.5% Triton X-100 (Sigma-Aldrich,
Taufkirchen, Germany) in 1xPBS. Afterwards the sections were incubated in the
primary antibody solution containing 3% normal horse serum (Dianova, Hamburg,
Germany) and 0.5% Triton X-100 in 1xPBS for 48 hours at 4°C. The primary
antibodies used were rabbit anti-PDGFR-α antibody (1:2000; Cell signalling,
Frankfurt a.M., Germany), mouse anti-APC (CC-1; 1:200; Merck, Darmstadt,
2. Materials and Methods
Germany), rabbit anti-ionized calcium-binding adapter molecule 1 (IBA1; 1:1000,
Wako, Neuss, Germany) and rabbit anti-APP (1:850; Millipore, Schwalbach,
Germany). Slides were washed for 5 minutes 5 times and then incubated in the
secondary antibody solution containing 3% normal horse serum, 0.5% Triton X-100
and biotinylated goat anti-rabbit or anti-mouse antibody (1:200; Vector Laboratories,
BA-1000) in 1xPBS. Incubation took place for 1.5 hours at room temperature
followed by 3 washing steps for 5 minutes with 1xPBS. Next, 1.5 hour incubation at
room temperature in the peroxidase-labeled avidin-biotin kit (Vectastain ABC Kit,
Vector Laboratories, Burlingame, USA) followed. The solutions had to be prepared
30 minutes prior using (ABC-Complex dilution: 2 drops of solution A + 2 drops of
solution B in 10 ml 1xPBS). Slides were again washed for 5 minutes 3 times in
1xPBS and then incubated in diaminobenzidine (DAB) solution (2 ml DAB + 36 μl
H2O2 in 100 ml PBS; Sigma-Aldrich, Taufkirchen, Germany) for 1-2.5 minutes. Slides
were washed in ddH20 and air-dried over night. Slides were put in xylol for 5 minutes
(Chemie-Vertrieb Hannover GmbH, Hannover, Germany) and then mounted with
non-aqueous DePeX (Serva, Heidelberg, Germany).
For the APP staining a counterstaining with haematoxylin was performed.
Immediately after the DAB reaction, the slides were incubated in haematoxylin
(Sigma Aldrich, Taufkirchen, Germany) for 30 s followed by washing for 5 minutes in
H20. Slides were dried and coverslipped as described above.
2.9.4 Quantification of the cell numbers
Two ROIs within the corpus callosum were defined. The „rostral region‟
encompassed bregma 1.10 to -0.10; it began with the section where the corpus
callosum is connecting the two hemispheres and the lateral ventricle appears
beneath and ended with the appearance of the 3rd dorsal ventricle (Figure 8A). The
„caudal region‟ included all sections of bregma 0.94 to -2.46 and started with the
section where the dentate gyrus is visible for the first time and ended when the
corpus callosum is separated again (Figure 8B). Images of the corpus callosum in
these regions were taken by a digital camera on a Zeiss light microscope (Zeiss,
Oberkochen, Germany) connected to a computer with the Kappa imaging software
(Kappa Optronics GmbH, Gleichen, Germany). A 40x oil objective was used for all
images. The single images of one brain section were merged to a continuous image
using Adobe Photoshop CS2 (Adobe Systems, San Jose, USA) and the tool
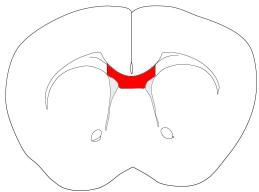
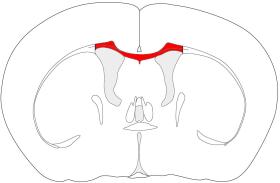
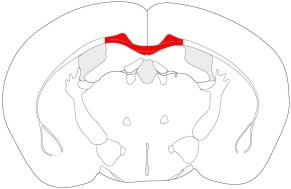
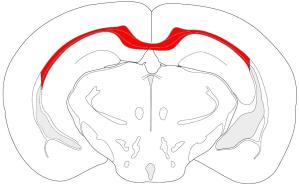
2. Materials and Methods
„photomerge‟. In these images the area of the corpus callosum was measured and
the cell counting was performed using Image J software
and the tool „cell count‟. The results were calculated as cells per mm2.
Figure 8: Illustration of the area of the corpus callosum used for quantification analysis. (A) rostral
region bregma 1.10 to -0.10 and (B) caudal region from bregma 0.94 to -2.46.
2.10 Intra- and Interrater reliability
Intra- and interrater reliability was conducted to ensure the accuracy of the analyses
of the MRI and cell counting data. All comparisons revealed significant correlations
and were always ≥95%. SPSS for Windows version 17.0
was used for this analysis.
2.11 Western blot analysis
For western blot analysis the mice were deeply anesthetized with 0.25%
tribromoethanol (Avertin) and sacrificed by decapitation. The brains were dissected
out and the cortex, hippocampus and cerebellum of both hemispheres were
separately quick frozen on dry ice. Additionally, kidney and liver were taken as
possible control organs. Samples were stored at -80°C until use.
Protein extraction from brain tissue
All chemicals from Sigma Aldrich, Taufkirchen, Germany if not otherwise stated.
The lysis buffer (pH 8.3) for protein extraction contained: 50 mM Tris HCL
((tris(hydroxymethyl)aminomethane hydrochloride); pH 7.4), 150 mM Natrium
chloride (NaCl; Merck, Darmstadt, Germany), 40 mM Natriumfluoride (NaF), 5 mM
Ethylendiamin-tetraacetat (EDTA), 5 mM ethylene glycol tetraacetic acid (EGTA), 1
Natriumdesoxycholat and 0.1% Sodium dodecyl sulfate (SDS).
2. Materials and Methods
Just before use protease inhibitors were added: 1 mM Phenylmethylsulfonylfluoride,
10 µg/ml Aprotinin and 1 mM Leupeptin (both Roche, Penzberg, Germany).
Either 200 µl lysis buffer for cortex samples or 150 µl for hippocampus samples was
used for each sample. Each sample was put into a glass homogenizer (VWR,
Darmstadt, Germany) and the lysis buffer was added, the tissue was smashed
immediately and then put on dry ice to freeze the sample. A cycle of freezing and
thawing was repeated 4 times which was then followed by sucking the lysed material
up and down with a heparin syringe (10 times). The material was transferred to a 2
ml tube (Eppendorf, Hamburg, Germany) and centrifuged (Thermo Fisher Scientific,
Walldorf, Germany) at 12000 rpm at 4°C for 45 minutes. The supernatant was
transferred to a fresh 2 ml tube (Eppendorf, Hamburg, Germany) and the volume was
estimated, 10 µl were stored for protein estimation and 1/3 of 4x Laemmli (1 M Tris
HCL (pH 8.3), 8% SDS, 40% Glycin, 20% ß-Mercaptoethanol, 0.04% Pyronin Y in
ddH20) was added to the rest followed by a heating step for 5 minutes at 95°C or
55°C (for PLP). Samples were stored at -80°C until use.
Protein estimation
The protein estimation was done using the Lowry-method. First a standard curve was
prepared using a stock solution of albumin (1 mg/ml; Thermo Fisher Scientific,
Walldorf, Germany) and ddH20. The final albumin concentrations were 0, 2.5, 7.5, 10,
12.5, 15, and 20 µg/150 µl. For the samples, a dilution of 1:50 or 1:25 in ddH20 was
prepared. 1 ml of freshly prepared Copper solution (100 parts 2% Na2CO3 in 0.1 M
NaOH (Roth, Lauterbourg, France), 1 part 2% K-Na-Tartrat in H20 (Merck,
Darmstadt, Germany), 1 part 1% CuSO4 in H20 (Merck, Darmstadt, Germany)) was
added to each sample and the standard curve. Incubation time was 15 minutes.
Next, 100 µl of Folin-Ciocalteu phenol reagent (Merck, Darmstadt, Germany) was
added to each tube, immediately mixed and incubated for 45 minutes. To measure
the protein concentration, a triplicate of every sample was created by 200 µl/well in a
96 well plate. The absorbance at 595 nm was determined in the plate reader (Dynex,
Denkendorf, Germany). The final concentration of samples was calculated.
2. Materials and Methods
Quantification of myelin proteins
For MBP 16% Tris-Glycine precast gels and for all other proteins 4-12% Bis-Tris
precast gels (all Invitrogen, Darmstadt, Germany) were used.
(1) 16% Tris-Glycine gels: 1x Tris Glycine SDS running buffer (for a 10x stock
solution: 25 mM Tris Base, 195 mM Glycine, 0.1% SDS in ddH20; pH 8.3) and Tris-
Glycine transfer buffer (Tris Base 12 mM, 96 mM Glycine, 20% Methanol (J.T. Baker,
Griesheim, Germany) in ddH20) were used. Running time was set to 2.5 hours, 125
Volt; transfer time was set for 90 minutes, 25 Volt.
(2) 4-12% gels: 1x MES-Running buffer (Invitrogen, Darmstadt, Germany) and Bis-
Tris transfer buffer (25 mM Bicine, 25 mM Bis-Tris, 1 mM EDTA in ddH20, add 20%
of methanol; pH 7.2) were used. Running time was set to 45-60 minutes, 200 Volt;
transfer time was set for 90 minutes, 30 Volt.
Precast gels were rinsed with ddH20; tape at the bottom was removed and placed
into the western blot chamber (Invitrogen, Darmstadt, Germany). The notched side of
the gels faced inward of the chamber. Running buffer was filled to the whole
chamber, the samples (15 µg/well) and SeeBlue™Plus2 Pre-Stained Protein
Standard (10 µl; Invitrogen, Darmstadt, Germany) was loaded and the run started.
For the transfer, the pads and nitrocellulose membrane including filter paper
(Invitrogen, Darmstadt, Germany) were soaked in transfer buffer at least 15 minutes
before use. When the run was completed, the gels were removed from the plastic
tray and a sandwich of 3 pads, 1 filter paper, the gel, membrane, filter paper and 2
pads was created. The blot module was placed in the western blot chamber and the
transfer buffer was filled into the center until the gel-membrane sandwich was
covered. The outer chamber was filled with H20. The transfer was started.
When transfer was completed, the membranes were stained with Ponceau-S (Serva,
Heidelberg, Germany) for 2-5 minutes to control the quality of the transfer.
Membranes were rinsed with ddH20, washed with TBST (50 mM Tris, 150 mM NaCl
and 0.5 ml/1 liter Tween20; pH 7.4) for 5 minutes 3 times and placed in 5% (w/v)
non-fat milk in TBST for 1 hour at room temperature. Primary antibodies were diluted
2. Materials and Methods
in 5% non-fat milk in TBST and put in a 50 ml Falcon tube (Greiner, Frickenhausen,
Germany). The antibodies used were: PLP (1:5000 (Jung et al, 1996)), CNPase
1:1000, MBP 1:2000 (Dako, Hamburg, Germany), MOG 1:2500 (kindly provided by
Prof. Nave). GAPDH (1:5000; Assay design; Lörrach, Germany) served as a loading
control. Membranes were incubated in the primary antibodies over night at 4°C.
On the next day, membranes were washed for 15 minutes 3 times in TBST and
incubated in anti-rabbit or anti-mouse secondary antibody coupled to horseradish
peroxidase (1:2000; Vector Laboratories, Burlingame, USA) for 1 hour at room
temperature. Membranes were again washed for 15 minutes 3 times.
Immunoreactive bands were visualized by incubation of membranes in a
chemiluminescence solution containing HRP Substrate Peroxide Solution and HRP
Substrate Luminol Reagent in a 1:1 dilution (Millipore, Billerica, MA, USA) for 5
minutes. To detect the chemiluminescence signal, a Bio-Rad GelDoc set-up (Bio-
Rad, Munich, Germany) was used. Densitometrical analysis were done using the
Quality One 4.6.9. software (Bio-Rad, Munich, Germany).
2.12 Isolation of total RNA and quantitative real-time RT-PCR (qPCR)
Isolation of RNA from frozen brain sections
Two coronal brain sections per mouse, including the rostral and caudal part of the
corpus callosum, were used to isolate total RNA according to the RNeasy FFPE kit
(Qiagen, Hilden, Germany). First the sections were washed 3 times 5 minutes in
1xPBS, then the two sections per mouse were pooled in a 2 ml tube (Eppendorf,
Hamburg, Germany), 150 µl PKD buffer was added and mixed by vortexing followed
by centrifugation for 1 minute at 10000 rpm (Eppendorf, Hamburg, Germany). 10 µl
of proteinase K was added to the lower, clear phase and mixed by pipetting up and
down. Samples were incubated first at 56°C for 15 minutes and then at 80°C for 15
minutes followed by 3 minutes on ice before centrifugation for 15 minutes, 13500
rpm. 16 µl of DNase Booster buffer and 10 µl of DNase I stock solution were added,
mixed and incubated for 15 minutes at room temperature. A volume of 320 µl RBC
buffer was added and mixed, followed by addition of 720 µl ethanol (100%). After
samples were well mixed, 700 µl were put on an RNeasy MinElute spin column
placed in a 2 ml collection tube. Centrifugation took place for 15 s, 10000 rpm. The
flow-through was discarded; this step was repeated until the entire sample was used.
Next, 500 µl RPE buffer was added to the spin column and centrifuged at 10000 rpm
2. Materials and Methods
for 15 s. The flow-through was again discarded. Again 500 µl RPE buffer was added
to the spin column and centrifuged at 10000 rpm for 2 minutes. The spin column was
placed in a new 2 ml collection tube and centrifuged at 10000 rpm for 5 minutes. The
collection tube and flow-through were discarded. The spin column was placed in a
new 1.5 ml collection tube, 30 µl RNase-free water was added and the RNA was
eluted by centrifugation at 10000 rpm for 1 minute. RNA concentration was
measured with a UV-spectrometer (GeneQuant II, Pharmacia Biotech, Piscataway,
NJ,. USA) at an absorbance of λ=260 nm. The RNA concentration ranged from 36-
140 ng/µl. First strand cDNA was generated from total RNA using 10 µl RNA and 2 µl
N6 random primers (50 µmol). Annealing took place at 70°C for 2 minutes, samples
were cooled down on ice and the master mix containing 4 µl 5x 1st strand buffer, 2 µl
0.1 M DTT, 1 µl dNTPs (20 mM each) and 1 µl Superskript III (200 U/µm) (all from
Invitrogen, Darmstadt, Germany) was added. Cycling was done for 10 minutes at
26°C, followed by 45 minutes at 50°C and 45 minutes at 55°C (UNO Thermoblock,
Biometra, Göttingen, Germany). The cDNA was diluted 1:10 with ddH2O.
Quantitative RT-PCR
The relative concentrations of mRNAs of interest in different cDNA samples were
measured out of 3 replicates using the threshold cycle method (delta Ct) for each
dilution and were normalized to a normalization factor derived from levels of
'housekeepers', GAPDH, beta-actin and HPRT1 mRNA, calculated with
geNorm_win_3.5 (Vandesompele et al, 2002). Reactions were performed using 4 µl
of diluted cDNA and 6 µl master mix containing SYBR green (ABgene, Foster City,
CA, USA) and 5 pmol of the forward and reverse primer, respectively.
Cycling was done for 2 minutes at 50°C, followed by denaturation at 95°C for 10
minutes. The amplification was carried out with 45 cycles of 95°C for 15 s and 60°C
for 60 s (Light Cycler480, Roche, Penzberg, Germany). The specificity of each primer
pair was controlled with a melting curve analysis. For qPCR, the following primers
were used: Mouse interleukin-1α (IL-1α) forward: 5‟-TCA ACC AAA CTA TAT ATC
AGG ATG TGG-3‟, reverse: 5‟-CGA GTA GGC ATA CAT GTC AAA TTT TAC-3‟;
mouse interleukin-1β (IL-1β) forward: 5‟-AAG GGC TGC TTC CAA ACC TTT GAC-3‟,
reverse: 5‟-ATA CTG CCT GCC TGA AGC TCT TGT-3‟; mouse transforming growth
factor-β (TGF-β) forward: 5‟-TGA CGT CAC TGG AGT TGT ACG-3‟, reverse: 5‟-GGT
TCA TGT CAT GGA TGG TGC-3‟; mouse complement component 1, q
2. Materials and Methods
subcomponent, A chain (C1qA) forward: 5' CGG GTC TCA AAG GAG AGA GA 3',
reverse: 5' CCT TTA AAA CCT CGG ATA CCA GT 3'; mouse triggering receptor
expressed on myeloid cells-2 (Trem-2) forward: 5‟-ACA GCA CCT CCA GGA ATC
AAG-3‟, reverse: 5‟-CCA CAG CCC AGA GGA TGC-3‟; mouse GAPDH forward: 5‟-
CAA TGA ATA CGG CTA CAG CAA C-3‟, reverse: 5‟-TTA CTC CTT GGA GGC CAT
GT-3‟; mouse beta-actin forward: 5‟-CTT CCT CCC TGG AGA AGA GC-3‟, reverse:
5‟- ATG CCA CAG GAT TCC ATA CC-3‟; mouse HPRT1 forward: 5‟-GCT TGC TGG
TGA AAA GGA CCT CTC GAA G-3‟, reverse: 5‟-ATG CCC TTG ACT ATA ATG AGT
ACT TCA GGG-3‟.
2.13 Statistical analysis
Data were compared using 2-way or 3-way ANOVA for repeated measures including
Bonferroni testing if applicable, and the Mann-Whitney-U-test for inter-group
comparisons. Because the analyses concerning EPO were highly hypothesis driven,
a one-sided Mann-Whitney-U-test was used. Significance level was set to p<0.05.
Data are presented as mean±SEM if not stated otherwise. The data were analyzed
using Prism5 (Graphpad Software, San Diego, CS, USA) and SPSS for Windows
3 RESULTS
3.1 Establishment of the cuprizone model
To establish the cuprizone model, a pilot experiment was performed. As described in
detail in the Materials and Methods section, 8 week old C57BL/6 male mice were fed
with either normal food pellets or food pellets containing 0.2% cuprizone over a
period of 7 weeks. The body weight of mice and the motor performance on a rota-rod
(constant speed 16 rpm) were monitored. Both experimental groups gained weight
over the 7 weeks (Figure 9; 2-way ANOVA for repeated measures, F6,492=746,14,
P<0.001). Until week 4 the mice were not impaired in their motor performance
(Figure 10A), to make the motor task more difficult the rota-rod protocol was
changed; the rotation of the rotating drum started with a speed of 4 rpm and
accelerated to 40 rpm within 5 minutes. Based on the challenge of the new rota-rod
protocol a decrease in the performance in both groups was observed (Figure 10B).
However, there was no difference between the groups. To check for demyelination a
LFB staining was performed. The cuprizone-fed mice had a normal myelinated
corpus callosum (Figure 11). Based on the histology and data for the body weight of
mice a second pilot experiment was designed. Cuprizone was administered via food
pellets or mixed into standard rodent ground chow.
Figure 9: First pilot experiment. Body weight of mice fed with normal
food pellets (Placebo) or food pellets containing 0.2% cuprizone over
the whole experimental time. Mean±SEM presented; N= 42-44/group.
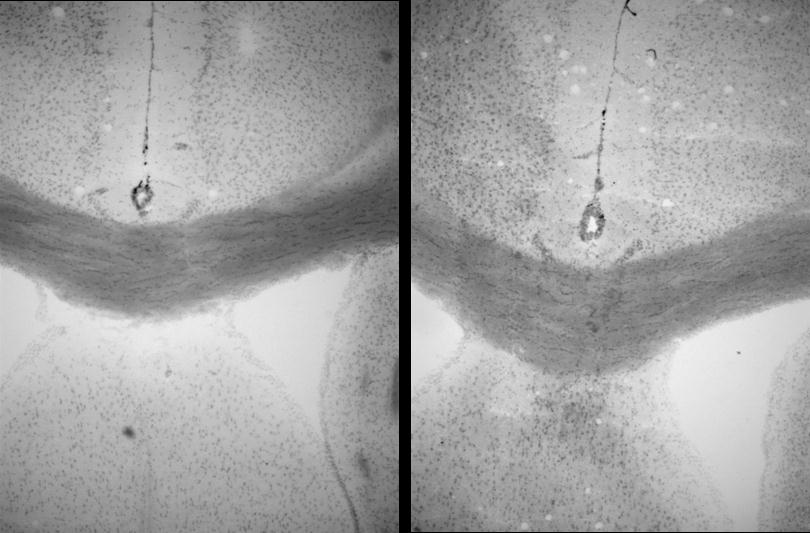
A Constant rota-rod
B Accelerated rota-rod
Figure 10: First pilot experiment. (A) Rota-rod performance of mice from weeks 1 to 4 with a constant
speed of 16 rpm. (B) Rota-rod performance of mice from weeks 5 to 7 with accelerated speed from 4
to 40 rpm. Mean±SEM presented; N= 42-44/group.
Placebo (6 weeks)
Cuprizone (6 weeks)
Figure 11: First pilot experiment. Presentation of a LFB-staining in the
corpus callosum of a mouse fed for 6 weeks with normal food pellets
(Placebo) and a mouse fed with food pellets containing 0.2% cuprizone.
In the second pilot experiment, the application of cuprizone via pellets or ground
chow was compared (for the experimental design see Materials and Methods section
2.5.1). The main readout was body weight of mice. This parameter was significantly
influenced by the cuprizone feeding of mice via ground chow (3-way ANOVA for
repeated measures, F(2,3)=55,80, P=0.004). Already 4 days after the application of
0.2 or 0.3% cuprizone mixed into ground chow these mice lost weight. The body
weight further decreased and stayed on a constantly lower level until the end of the
experiment (Figure 12A). Two mice fed with 0.3% cuprizone and one mouse of the
0.2% diet-group died on day 19. In comparison no weight loss and even a gain of
weight over time was observed in mice fed 0.2% cuprizone via food pellets (Figure
12B; 2-way ANOVA for repeated measures, F(6,24)=131,75, P<0.001). Toxicological
analysis of the food pellets confirmed that cuprizone was present, intact and active
(see Supplement 6.1; performed in the Department of Pharmacology and Toxicology
at the University hospital Göttingen, Germany). Based on these findings all future
experiments were performed with 0.2% cuprizone mixed into standard rodent chow.
Figure 12: Second pilot experiment. (A) Body weight of mice fed with normal ground chow (Placebo)
or cuprizone mixed into ground chow. Cuprizone feeding significantly influenced the body weight of
mice (3-way ANOVA F(2,3)=55,80, P=0.004). (B) Body weight of mice fed with normal food pellets
(Placebo) or food pellets containing 0.2% cuprizone. No effect of feeding. Mean±SEM presented; N=
3.2 Effect of EPO on re- and demyelination
3.2.1 Overview of analyzed parameters
In the following tables, an overview of the analyzed parameters in the two studies
investigating the effect of EPO on remyelination (Table 6) and demyelination (Table
7) is presented. In the study which analyzed the effect of EPO on remyelination
(Table 6) mice were not sacrificed at weeks 6 and 15, therefore only behavioral
analyses were performed at these time points. The lack of data at some of the other
time points in both studies is due to the results obtained from previous time points or
the other parameters at that time. Additional analyses were not thought to give
further insight into the EPO effect under the given experimental conditions.
EPO effect on remyelination
Table 6: Effect of EPO on remyelination. Overview of the parameters analyzed at different time
points. (ABR: auditory brain stem response; WB: western blot; MTR: magnetization transfer ratio)
Parameters analyzed
Startle response
Protein analysis (WB)
Immunohistochemistry
EPO effect on demyelination
Table 7: Effect of EPO on demyelination. Overview of the
parameters analyzed at different time points. (ABR: auditory
brain stem response; WB: western blot; MTR: magnetization
Parameters analyzed
Startle response
Protein analysis (WB)
Immunohistochemistry
3.2.2 Effect of EPO on remyelination
3.2.2.1 Basic observations under cuprizone and EPO treatment
Cuprizone application took place either once over 6 weeks followed by a
remyelination phase of 3 weeks combined with intra-peritoneal placebo or EPO
injections or repeatedly; a second cycle of cuprizone feeding and a second
remyelination phase combined with placebo/EPO injections occurred after the first
recovery phase (see Materials and Methods section 2.5.2.2). Cuprizone feeding
significantly decreased the body weight over time (3-way ANOVA for repeated
measures, F(1,55)=212,28, P<0.001). A fast recovery in the first and even second
remyelination phase was observable (Figure 13A and B). However, even in the third
recovery week (weeks 9 and 18) the body weight of cuprizone-fed mice was always
below the control groups. Interestingly, in the second demyelination phase (weeks
10-15) the body weight of EPO-treated cuprizone mice did not decline as much as
compared to the placebo-treated cuprizone mice. However, this difference did not
reach significance levels.
Figure 13: Effect of EPO on remyelination. (A) Body weight of mice in the single feeding group; N=20;
(B) body weight of mice in the repeated feeding group; N=15-25. The cuprizone mice showed a
significantly lower body weight over time compared to the controls (3-way ANOVA for repeated
measures, F(1,55)=212,28, P<0.001). Grey boxes indicate the recovery phases. Mean±SD presented;
PL=placebo; EPO=erythropoietin.
Evaluation of the haematocrit at weeks 9 and 18 revealed a significant increase by
EPO treatment in both the control and cuprizone group (Figure 14; Mann-Whitey U-
test, P<0.001).
Figure 14: Effect of EPO on remyelination. Haematocrit of mice
at (A) week 9; N=11-15 and (B) week 18; N=7-10. Mean±SEM
presented; PL=placebo; EPO=erythropoietin.
3.2.2.2 Motor coordination and balance under cuprizone and EPO treatment
The results of the accelerated rota-rod, which is a relatively crude test for motor
function, showed that all mice improved their performance over time (Figure 15; 3-
way ANOVA for repeated measures, F(18,990)=35.97, P<0.001). Cuprizone did not
influence the performance of the mice in this test either had EPO any effect.
Figure 15: Effect of EPO on remyelination. Falling latency on the
accelerated rota-rod (4-40 rpm). Grey boxes indicate the recovery phases.
N=14-25; mean ±SEM presented; PL=placebo; EPO=erythropoietin.
Beam balance is a test for vestibulomotor function in mice. At week 15, directly after
the second cycle of demyelination, cuprizone/placebo mice needed significantly more
time to cross the 10 and 8 mm beam compared to the control group (Mann-Whitey U-
test, P≤0.003). EPO treatment of cuprizone mice significantly improved the
performance on the 8 mm beam (Figure 16; Mann-Whitey U-test, P=0.015). After the
second recovery phase, cuprizone-fed mice had a higher duration to cross the beam
compared to controls without an additional effect of EPO.
Figure 16: Effect of EPO on remyelination. The beam balance test was performed at weeks 15 and 18.
A 10 and 8 mm diameter beam was used and the time to cross the beam (duration) was recorded.
N= 14-15; mean ±SEM presented; PL=placebo; EPO=erythropoietin.
3.2.2.3 Startle response of mice
The observation of a disturbed behavior in the pre-pulse-inhibition test excluded the
analysis of these data (therefore data not shown), and led to the assessment of
hearing using the startle response test. This test measures the startle response of
mice to acoustic stimuli in a range of 65 to 120 dB. At weeks 6, 15, and 18, both
cuprizone groups showed a significantly reduced startle response without any further
influence of EPO (Figure 17; 2- or 3-way ANOVA for repeated measures, P≤0.001).
To further analyze whether this is in fact a result of an impaired hearing ability of the
mice, acoustic evoked potentials were measured (collaboration with Nicola Strenzke,
Department of Otorhynolaryngology, University hospital Göttingen, Germany).
However, no group differences were observed in the amplitude or latency of the
recorded ABRs at week 18 (Figure 18).
Cuprizone PLCuprizone EPO
65 70 75 80 85 90 95 100 105 110 115 120
65 70 75 80 85 90 95 100 105 110 115 120
65 70 75 80 85 90 95 100 105 110 115 120
65 70 75 80 85 90 95 100 105 110 115 120
Figure 17: Effect of EPO on remyelination. Assessment of hearing measured by the startle response
of mice to acoustic stimuli ranging from 65 to 120 dB. This test was performed at weeks 6, 9, 15, and
18. N= 12-15; mean±SEM presented; PL=placebo; EPO=erythropoietin; AU = arbitrary unit.
Cuprizone PLCuprizone EPO
Figure 18: Effect of EPO on remyelination. Assessment of hearing by the recording of acoustic evoked
brain stem responses to 20 Hertz stimuli at week 18; N=6. PL=placebo; EPO=erythropoietin.
3.2.2.4 Analysis of myelin proteins in the hippocampus and cortex
Besides investigating physical and behavioral parameter, changes related to myelin
were assessed on protein level. The cortex and hippocampus were the regions of
interest for myelin protein analysis. At week 9, after the first remyelination phase of 3
weeks, CNP, MOG (myelin oligodendrocyte glycoprotein) and MBP were significantly
decreased in the cortex of cuprizone mice (Figure 19; Mann-Whitey U-test, PL vs.
Cuprizone PL, P<0.01). PLP showed the same trend but failed to be significant. In
contrast, all these myelin proteins were not affected in the hippocampus of
cuprizone-fed mice at this time point (Figure 19). EPO did not show any effect.
MBP (17 and 18.5 kDa)
MBP (17 and 18.5 kDa)
Figure 19: Effect of EPO on remyelination. Analysis of the myelin proteins: CNP (2‟-3‟-cyclic nucleotide
3'-phosphodiesterase), MOG (myelin oligodendrocyte glycoprotein), PLP (proteolipid protein) and
MBP (myelin basic protein) in the cortex and hippocampus at week 9; N=7; mean±SEM presented;
PL=placebo; EPO=erythropoietin.
At week 18, after the second recovery phase, all myelin proteins in both cortex and
hippocampus were significantly reduced (Mann-Whitey U-test, PL vs. Cuprizone PL,
P<0.01). No effect of EPO was present (Figure 20).
MBP (17 and 18.5 kDa)
MBP (17 and 18.5 kDa)
Figure 20: Effect of EPO on remyelination. Analysis of the myelin proteins: CNP (2‟-3‟-cyclic nucleotide
3'-phosphodiesterase), MOG (myelin oligodendrocyte glycoprotein), PLP (proteolipid protein) and
MBP (myelin basic protein) in the cortex and hippocampus at week 18; N=8-10; mean±SEM
presented; PL=placebo; EPO=erythropoietin.
3.2.2.5 Volumetrical analysis of cuprizone-fed mice
At the end of the experiment (week 18) MRI took place. Cuprizone-fed mice did not
show any sign of brain atrophy as analyzed by T1-maps (Figure 22; Brain matter). In
all cuprizone mice an obvious enlargement of the ventricular system was apparent
(as illustrated in Figure 21), although it was not significant. High variations in the
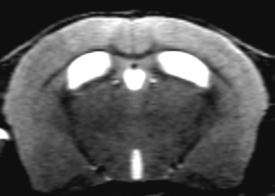
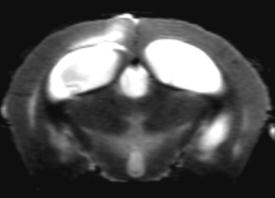
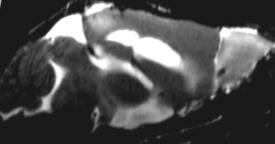
measurement of the ventricular volume within the cuprizone groups became
apparent (error bars in Figure 22). EPO had no additional effects in this analysis.
Figure 21: Effect of EPO on remyelination. T2-
weighted sample image to illustrate the
enlargement of the ventricular system of mice
fed with 0.2% cuprizone. Images kindly
provided by Susann Boretius.
Lateral ventricle right
Lateral ventricle left
Figure 22: Effect of EPO on remyelination. Volumetrical analysis of the total brain, brain matter,
hippocampus and ventricular system at week 18; N=6; mean±SEM presented; PL=placebo;
EPO=erythropoietin.
In summary, the study of investigating the effect of EPO on remyelination showed
that cuprizone feeding had a potent effect on the body weight of mice, vestibulomotor
function, myelin protein levels in the brain and brain volumetrical parameters
(ventricular system). EPO application had a slight effect on the body weight of mice
during the second demyelination phase and significantly improved the performance
in the beam balance task at week 15. No further beneficial effect of EPO was
3.2.3 Effect of EPO on demyelination
3.2.3.1 Basic observations under cuprizone and EPO treatment
The cuprizone diet was again applied for 6 weeks and was followed by a
remyelination phase of 3 weeks. In weeks 4-6 of cuprizone feeding placebo/EPO
treatment was applied (see experimental scheme in Materials and Methods section
2.5.3). The body weight of mice was significantly reduced by the cuprizone feeding
(3-way ANOVA for repeated measures, F(1,56)=235,61, P<0.001) and returned to
comparable levels to the controls after 3 weeks recovery (Figure 23A). The
haematocrit of EPO-treated mice in both the control and cuprizone group was
significantly increased at week 6 (Mann-Whitey U-test, P≤0.001), directly after the
termination of the treatment. Both groups reached normal levels after the recovery
period (week 9; Figure 23B).
Figure 23: Effect of EPO on demyelination. (A) Body weight of mice. Cuprizone-fed mice had
significantly lower body weight over time compared to controls (3-way ANOVA for repeated measures,
F(1,56)=235,61, P<0.001); N=15-26; mean±SD presented. Grey box indicates the recovery phase. (B)
Haematocrit of mice at weeks 6 and 9; EPO significantly enhanced the haematocrit at week 6 (Mann-
Whitey U-test, P≤0.001). N=6-15; mean±SEM presented; PL=placebo; EPO=erythropoietin.
3.2.3.2 Motor coordination and balance under cuprizone and EPO treatment
At baseline, before the cuprizone feeding started, the performance of mice on the
rota-rod was comparable and all groups showed an improvement of the performance
from day 1 to 2 (Figure 24, 3-way ANOVA for repeated measures, F(2,100)=5.90,
P=0.017). 6 weeks after cuprizone initiation all mice showed a comparable
performance on the rota-rod and improvement over the 3 testing days (Figure 25A, 3-
way ANOVA for repeated measures, F(2,194)=12.57, P<0.001). No differences
between groups were detected after the 3 week recovery phase (Figure 25B).
gure 24: Effect of EPO on demyelination.
aseline performance in a 2-day rota-rod
paradigm (acceleration 4-40 rpm). N=26;
PO=erythropoietin.
Figure 25: Effect of EPO on demyelination. Falling latency in a 3-day rota-rod paradigm (acceleration
4-40 rpm) at (A) week 6; all mice improved their performance over time (3-way ANOVA for repeated
measures, F(2,194)=12.57, P<0.001); N=24-26 and (B) week 9; N=15. Mean±SEM presented;
PL=placebo; EPO=erythropoietin.
In the beam balance task, all mice at baseline showed a comparable duration to
cross the 10 and 8 mm beam (Figure 26). At week 6, the cuprizone-fed mice needed
significantly longer time to cross the 10 and 8 mm beam (Mann-Whitey U-test, PL vs.
Cuprizone PL, P<0.001). However, EPO-treated cuprizone mice improved their
performance on the 10 mm beam and significantly on the 8 mm beam (Figure 27;
Mann-Whitey U-test, P=0.004). At week 9, both cuprizone groups recovered and
reached almost control levels without any additional effect of EPO (Figure 27).
Figure 26: Effect of EPO on demyelination. Baseline
performance on the 8 and 10 mm beam. The time to
cross the beam (duration) was measured. N=24-26;
mean±SEM presented; PL=placebo; EPO=erythropoietin.
Figure 27: Effect of EPO on demyelination. Beam balance test performed on the 8 and 10 mm beam
at weeks 6 and 9. At week 6, cuprizone mice showed a higher duration to cross the beam (Mann-
Whitey U-test, PL vs. Cuprizone PL, P<0.001). N=14-26; mean±SEM presented; PL=placebo;
EPO=erythropoietin.
3.2.3.3 Startle response of mice
To evaluate the startle response of mice in the current experimental conditions and to
prove the previous observations, this test was performed again. A similar picture was
present; whereas all groups showed a similar startle response at baseline (Figure
28), at week 6, cuprizone feeding significantly reduced the startle response of mice
(Figure 29; 3-way ANOVA for repeated measures, F(1,87)=61.65, P<0.001). This effect
disappeared after 3 weeks recovery. No effect of EPO was present.
Figure 28: Effect of EPO on demyelination.
Assessment of hearing at baseline. The
startle response of mice to acoustic stimuli
ranging from 65 to 120 dB was measured.
N=26; mean±SEM presented; PL=placebo;
EPO=erythropoietin; AU=arbitrary unit.
65 70 75 80 85 90 95 100 105 110 115 120
65 70 75 80 85 90 95 100 105 110 115 120
65 70 75 80 85 90 95 100 105 110 115 120
Figure 29: Effect of EPO on demyelination. Assessment of hearing at weeks 6 and 9 by
measuring the startle response of mice to acoustic stimuli ranging from 65 to 120 dB. At
week 6, cuprizone mice showed a significant reduced startle response (3-way ANOVA
for repeated measures, F(1,87)=61.65, P<0.001). N=15-26; mean±SEM presented;
PL=placebo; EPO=erythropoietin; AU=arbitrary unit.
3.2.3.4 Volumetrical analysis of cuprizone-fed mice
At two time points, weeks 6 and 9, MRI was performed. As seen already in the
previous experiment, cuprizone did not affect the brain matter of mice at any time
point (Figure 30). Interestingly, the volume of the hippocampus of cuprizone mice
was significantly reduced at week 6 (Mann-Whitey U-test, PL vs. Cuprizone PL,
P=0.005) and returned back to control levels at week 9. The brain volume of the
cuprizone/placebo mice was significantly enlarged at week 6 (Mann-Whitey U-test,
PL vs. Cuprizone PL, P=0.005). The analysis of the ventricular system (lateral
ventricle left and right and third ventricle) showed a huge increase of the ventricular
volume of cuprizone mice at week 6 (Mann-Whitey U-test, PL vs. Cuprizone PL,
P=0.005). This effect was significantly reduced by EPO (Figure 30). After a recovery
of 3 weeks the ventricles were still enlarged without any further effect of EPO.
Lateral ventricle left
Lateral ventricle right
Figure 30: Effect of EPO on demyelination. Volumetrical analysis of the brain volume, brain matter,
hippocampus, lateral ventricles and the third ventricle at weeks 6 and 9. N=4-6; mean±SEM
presented; PL=placebo; EPO=erythropoietin.
Additionally, the %MTR, a measurement of the degree of myelination, was analyzed.
This value was significantly decreased in cuprizone mice at week 6 (Mann-Whitey U-
test, PL vs. Cuprizone PL, P=0.01) whereas the cuprizone/EPO group showed
slightly higher levels (Figure 31). At week 9, this value was still not completely back
to control levels in both the cuprizone placebo and EPO group.
Figure 31: Effect of EPO on demyelination.
Analysis of the % magnetization transfer ratio
(%MTR) at weeks 6 and 9. N=4-6;
EPO=erythropoietin.
3.2.3.5 Examination of mature and precursor oligodendrocytes at week 6
For a better understanding of the observed effect of EPO on behavioral and imaging
parameters at week 6, this time point was selected to perform immunohistochemical
analysis for oligodendrocytes, microglia and axonal degeneration. Oligodendrocytes
were visualized by immunohistochemistry using the antibodies PDGFR-α and CC-1
(anti-APC). As illustrated in Figure 32, PDGFR-α nicely stains the cell body and
processes of precursor oligodendrocytes in the brain sections whereas CC-1 (anti-
APC) stains the cell body and cytoplasm of mature oligodendrocytes (Figure 33).
Both were analyzed in the corpus callosum 6 weeks after cuprizone initiation.
Precursor oligodendrocytes were significantly increased within the rostral and caudal
part of the corpus callosum upon cuprizone feeding (Figure 32 and 34 upper panels;
for both regions: Mann-Whitey U-test, PL vs. Cuprizone PL, P<0.001). No clear effect
of EPO was observable, although a trend of a slight decrease of precursor
oligodendrocytes was visible (Figure 34). Mature oligodendrocytes were heavily
depleted in the entire corpus callosum (Figure 33 and 34 lower panels; for both
regions: Mann-Whitey U-test, PL vs. Cuprizone PL, P<0.001). EPO was not able to
counteract this effect (Figure 34).
e 32: Effect of EPO on demyelination. Precursor
oligodendrocytes stained by PDGFR-α in the corpus callosum of
a control mouse (left) and a cuprizone mouse (right). Scale bar
oligodendrocytes stained by CC-1 (anti-APC) in the corpus
callosum of a control mouse (left) and a cuprizone mouse (right).
Scale bar 50µm.
Figure 34: Effect of EPO on demyelination. Quantification of
PDGFR-α+ precursor (upper panels) and APC+ mature
oligodendrocytes (lower panels) in the rotral and caudal corpus
callosum at week 6. Both cell types were significantly
influenced upon cuprizone feeding (Mann-Whitey U-test, PL
vs.Cuprizone PL, P<0.001). N=9-11; mean±SEM presented;
PL=placebo; EPO=erythropoietin.
3.2.3.6 Analysis of microglia and axonal degeneration at week 6
At week 6, microglia were stained with IBA-1 and quantified within the corpus
callosum. As illustrated in Figure 35, microglia in control mice were highly ramified
(left), whereas cuprizone-fed mice changed their morphometrics to amoeboid-like
cells (right). Quantification of these cells showed a dramatic increase in cuprizone
mice in both regions of the corpus callosum (Figure 36; Mann-Whitey U-test, PL vs.
Cuprizone PL, P<0.001). EPO decreased the number of microglia, slightly in the
rostral and significantly in the caudal corpus callosum (Figure 36; Mann-Whitey U-
Figure 35: Effect of EPO on demyelination. Highly ramified
microglia in the corpus callosum of control mice (right) and
amoeboid-like microglia in cuprizone mice (left) at week 6. Scale
Figure 36: Effect of EPO on demyelination. Quantification of IBA-1+
microglia in the rostral and caudal corpus callosum. Microglia were
significantly elevated upon cuprizone feeding (Mann-Whitey U-test,
PL vs. Cuprizone PL, P<0.001). N=7-11; mean±SEM presented;
PL=placebo; EPO=erythropoietin.
Axonal degeneration can be analyzed on the immunohistochemical level using the
APP antibody. Whereas no APP+ spheroids were visible at week 6 in control mice
(Figure 37 left), distinct accumulations were present in cuprizone mice (Figure 37
right; arrows). Quantification revealed a clear increase of APP+ accumulations in the
corpus callosum of cuprizone mice (Figure 38; Mann-Whitey U-test, PL vs. Cuprizone
PL, P<0.001). A decrease of axonal degeneration was visible in the caudal and more
pronounced in the rostral part of the corpus callosum upon EPO treatment (Figure
Figure 37: Effect of EPO on demyelination.
accumulations in the corpus callosum of control (left) and
cuprizone (right) mice at week 6. Arrows point to positive
accumulations. Scale bar 20µm.
Figure 38: Effect of EPO on demyelination. Quantification of
APP+ accumulations in the rostral and caudal corpus callosum.
Significant increase of axonal degeneration upon cuprizone
(Mann-Whitey U-test, PL vs. Cuprizone PL, P<0.001). N=8-11;
mean±SEM presented; PL=placebo; EPO=erythropoietin.
3.2.3.7 Expression of cytokines and mircoglia activity markers at week 6
To further evaluate the inflammatory component of the cuprizone model and potential
EPO effects in this context, quantification of brain mRNA levels of cytokines and
micoglial activity markers was performed. The analyzed cytokines, IL-1α and IL-1β,
showed a strong upregulation upon cuprizone feeding (Figure 39; Mann-Whitey U-
test, PL vs. Cuprizone PL, P<0.001). Similarly, two microglial activity markers, C1qA
and Trem-2, showed the same pattern (Figure 39; Mann-Whitey U-test, PL vs.
Cuprizone PL, P≤0.02). In contrast, TGF-β, a protective growth factor, was
downregulated by cuprizone (Mann-Whitey U-test, PL vs. Cuprizone PL, P=0.026).
Even though, in the most cases a small tendency of a counter regulation of EPO
could be detected, there was no clear effect of EPO in this readout.
Figure 39: Effect of EPO on demyelination. Quantification of cytokines (IL-1α, IL-1β &
TGF-β) and microglial activity marker (C1qA, Trem-2) on mRNA level at week 6.
Expression levels are normalized to a normalization factor (NF) and significantly
influenced by cuprizone (Mann-Whitey U-test, PL vs. Cuprizone PL, P<0.05). N=5-11;
mean±SEM presented; PL=placebo; EPO=erythropoietin.
4 DISCUSSION
The present thesis investigated whether EPO modulates cuprizone-induced de-
and/or remyelination processes in the corpus callosum, including related changes at
the behavioral, imaging, immunohistochemical, mRNA expression and myelin protein
levels. The selection of the cuprizone mouse model was based on several important
characteristics. As elaborated in the introduction, the feeding of mice with the toxin
cuprizone results in a marked demyelination of the corpus callosum, as well as other
brain regions such as hippocampus, cortex and cerebellum. The advantage of this
model, compared to EAE models, is to study myelination processes relatively
isolated from direct immune-inflammatory influences. Moreover, the model has a
recovery potential, allowing for investigation of events related to de- and
remyelination. An intact BBB in cuprizone-fed mice excludes massive infiltration of
peripheral immune cells. Two study designs were chosen to investigate the effect of
EPO in the most clinical relevant manner: (1) EPO treatment started directly after the
damage fully occurred (with the beginning of remyelination), or (2) EPO was given at
an earlier time point when the first signs of damage appeared (during the
demyelination phase). The hypothesis of the thesis was that EPO modulates the
cuprizone-induced changes in all readouts analyzed.
4.1 Establishment of the cuprizone model
First the cuprizone mouse model had to be established. Oriented by the available
publications about the cuprizone model (see Tables 1-5), 8 week old C57BL/6 male
mice were used. In the first pilot experiment, the mice were fed with either normal
food pellets or food pellets containing 0.2% cuprizone. This was done to make the
application of cuprizone more precise and practical and avoid unnecessary dispersal
of the toxin in the experimental room. Surprisingly, the feeding of mice with the
cuprizone-containing food pellets resulted in neither the known cuprizone-induced
decrease of body weight, nor in the demyelination of the corpus callosum. However,
a toxicological analysis proved that cuprizone was present, intact and active in the
food pellets (see Supplement 6.1). After a careful re-screening of the literature, it
became clear that cuprizone was always administered with ground chow and was
applied only once via drinking water (Zatta et al, 2005). Importantly, no publication
explicitly stated that cuprizone has to be administered via ground chow.
A second pilot experiment was designed in which a small number of 6-7 week old
mice were either exposed to ground chow containing 0.2 or 0.3% cuprizone or 0.2%
cuprizone-containing food pellets. The higher dose was additionally used to control
for the efficacy of different cuprizone doses. Younger mice were used to clarify if
these mice were more susceptible to cuprizone intoxication. Monitoring of the body
weight of mice clearly revealed a loss of body weight in mice fed with cuprizone
mixed into ground chow, but not in the mice fed with cuprizone-containing food
pellets, although these mice were even younger. A higher mortality rate of 0.3%
cuprizone-fed mice indicated an increased severity of this dose. Furthermore, mice at
an age below 8 weeks seemed to be highly susceptible to the toxin. With these data,
it was concluded that there must be other routes of cuprizone uptake such as via e.g.
skin or respiration to induce demyelination in mice. For all following experiments, 8
week old C57BL/6 male mice and 0.2% cuprizone mixed into standard ground chow
4.2 Effect of EPO on remyelination
Two aspects were the focus of the experiments concerning the effect of EPO on
remyelination: (1) The potential of EPO to support reparative mechanisms during
remyelination after acute myelin damage and (2) after repeated myelin damage. The
latter aspect was related to clinically relevant situations such as in a relapsing-
remitting disease course in MS.
The body weight changed as expected even during the repeated de- and
remyelination phase. Interestingly, the body weight of EPO-treated cuprizone mice
decreased less in the second demyelination cycle compared to placebo-treated
cuprizone mice, but this finding was not significant. Even in the second demyelination
phase, no impairment in general motor performance could be found as evaluated by
the accelerated rota-rod test. These two parameters (body weight and motor
performance) show a general physical robustness of the mice even after a repeated
cuprizone challenge. The measurement of haematocrit to monitor the effect of EPO
on erythrocytes showed that cuprizone feeding did not interfere with this effect of
EPO. Interestingly, as shown once before (Skripuletz et al, 2010b) the beam balance
task turned out to be sensitive enough to detect cuprizone-induced changes in motor
coordination and balance. What was even more striking was the fact that the task
was able to reveal protective effects of EPO at week 15. This finding, together with
the observation that EPO led to a reduced loss of body weight in the second
demyelination phase, suggests a protective effect of EPO in this experimental set-up.
Although a final explanation for reduced startle reactivity of mice upon cuprizone
feeding is not yet possible, a deficit in the hearing ability of cuprizone-fed mice could
be ruled out as a possible explanation. Additional analysis considering the influence
of body weight of mice in this test did not explain the finding either. Interestingly, a
reduced startle response was already seen in another study, though without further
clarification of this observation (Xu et al, 2009). Furthermore, a higher number of
mice showing freezing behavior to click stimuli was observed upon cuprizone
intoxication, but the strength of the freezing was not specified (Franco-Pons et al,
2007). Cuprizone-induced demyelination that may lead to connectivity problems
between brain regions and/or a generally poorer physical condition of the mice could
be just two hypothetical explanations. Further analyses are needed to clarify the
observed phenomenon.
Interestingly, the analysis of different myelin proteins after the first recovery period
(week 9) showed a severe depletion of the proteins in the cortex, whereas
remyelination in the hippocampus was already progressed and showed no
differences between control and cuprizone groups. After the second recovery phase
(week 18), all investigated myelin proteins were heavily reduced in both cortex and
hippocampus. However, at both time points no effect of EPO was present. The
differences between the cortex and hippocampus at week 9 could be explained,
either by a different susceptibility of the brain regions to cuprizone or by a better
recovery potential in the hippocampus. A hint of a different susceptibility to cuprizone
between brain regions was given by a study showing more severe demyelination in
the cortex compared to the corpus callosum (Skripuletz et al, 2008). The lack of a
recovery of the myelin proteins in both the cortex and hippocampus at week 18 could
be caused by an exhaustion of the myelin protein expression capacity by cuprizone
at this time point. However, to support this statement, data at e.g. the 15 week time
point would be needed to see the time course of the myelin protein expression. An
expression analysis of myelin proteins in the cortex and hippocampus in the
cuprizone model is not yet published and excludes a comparison of the presented
data to other studies. The raised statements above are therefore speculative but
were not topics in question to be further analyzed in this study.
The absence of an EPO effect on myelin proteins is surprising, especially because in
other models e.g. for juvenile brain trauma, an effect of EPO on myelin proteins was
demonstrated (Sargin et al, 2009). Discrepancies compared to this study can be
explained by different actions of EPO in different disease models and/or the age of
mice at the time point of EPO treatment. In the study by Sargin et al (Sargin et al,
2009), EPO application took place in 4 week old mice, whereas in the current study
the mice were 14 weeks old. Accumulating findings in our lab support the idea that
age can play a role at the time of EPO application. In addition to this, other reasons
for a lack of an EPO effect can be discussed. The analysis was restricted to the
cortex and hippocampus; clearer results in this study may have come about by
studying the myelin fraction of the brain. The time points of investigation were
restricted to 9 and 18 weeks to analyze the effect of EPO on remyelination potential,
but these may not be the most relevant ones to see EPO effects in this readout. In
general, it could be further speculated that EPO application was not performed in the
most relevant time window in this model. On the other hand, the specific cuprizone-
induced damage of myelin proteins could perhaps not have been counteracted by
Enlarged ventricles are a common feature in the cuprizone model (Carlton, 1966;
Carlton, 1967; Kesterson & Carlton, 1970). For instance, elevated ventricles were
reported by the first and so far only cuprizone study of repeated feeding (Pattison &
Jebbett, 1973). Although the design of this study differs compared to the present
study, the influence of cuprizone on the ventricular system could be found here as
well. EPO did not have an effect on this readout. However, the MRI analysis was
restricted to the end-point of the experiment, making it difficult to draw any final
conclusions regarding EPO action on this parameter.
To conclude, cuprizone had a potent effect on all parameters analyzed except the
rota-rod performance of mice and acoustic evoked potentials. EPO showed a
protective effect concerning body weight loss and vestibulomotor performance.
However, analyses on an immunohistochemical and protein level at comparable time
points are missing and make a conclusion of underlying mechanisms impossible. At
the end-point of this experiment (18 weeks), lack of an EPO effect in the MRI
parameter, myelin protein analysis and beam balance task suggest that the
cuprizone-induced damage at this time point may be too progressed or the recovery
potential is still too fast to detect an EPO effect.
4.3 EPO effect on demyelination
In this experimental set-up, EPO had no influence on the weight loss of cuprizone-fed
mice. The motor performance on the rota-rod confirmed the previous finding that
mice fed with cuprizone do not have a severe motor phenotype. This has already led
to the development of a more sophisticated motor task for this model by others
(Liebetanz & Merkler, 2006). Interestingly, at week 6 EPO again improved the
performance of cuprizone mice in the beam balance task, whereas at week 9 no
differences were obtained between any groups showing a high recovery potential.
Based on different time points investigated, direct comparison to the effect of EPO
observed in the beam balance task in the previous experiment is difficult.
Volumetrical analysis at week 6 again showed no influence of cuprizone on brain
matter. Interestingly, at this time point the hippocampal volume was reduced upon
cuprizone feeding. In MRI images, as well as in histological sections, the
hippocampus often appeared to be squeezed, which could be explained by the
significant enlargement of the ventricular system by cuprizone. The ballooned
ventricles may push the surrounding tissue, including the hippocampi, against the
skull. The EPO-treated cuprizone mice had significantly smaller ventricles compared
to the cuprizone/placebo mice.
So far, just one study intensively investigated the possible reasons for hydrocephalus
in the cuprizone mouse model (Kesterson & Carlton, 1970). In this study, the authors
suggested that hydrocephalus occurs secondary to the stenosis of the aqueduct of
Sylvius, which may result from pressure exerted by the surrounding edematous
tissue. The authors further claimed a normal secretion of cerebral spinal fluid. This is
of course just one possible explanation and was unfortunately never in the interest of
others to be further studied. However, EPO treatment during the demyelination
phase may have dampened the degenerative effect of cuprizone on the brain tissue
and therefore reduced the closure of the aqueduct of Sylvius. This could then explain
the smaller ventricle volume.
Since the %MTR, a MRI readout, correlates with myelination in the corpus callosum
(Merkler et al, 2005), the reduction of this value in cuprizone-fed mice at week 6
suggests demyelination occurring within the corpus callosum. EPO had the tendency
to increase this value. This is in agreement with studies showing better myelin sheath
preservation in different disease models by EPO (Gorio et al, 2002; Iwai et al, 2010;
Kumral et al, 2007; Li et al, 2004; Liu et al, 2011; Vitellaro-Zuccarello et al, 2007;
Yamada et al, 2011). Additionally, as shown before, immunohistochemical analysis
revealed a severe depletion of mature oligodendrocytes by cuprizone within the
corpus callosum without an additional effect of EPO. At the same time, precursor
oligodendrocytes were significantly increased by cuprizone but only slightly reduced
under EPO treatment. Indeed, studies which used other animal models found a clear
effect of EPO on proliferation and maturation of oligodendrocytes (Iwai et al, 2010;
Vitellaro-Zuccarello et al, 2007; Zhang et al, 2005; Zhang et al, 2010). The lack of an
EPO effect on oligodendrocytes in the present study might be explained by the time
point and brain region selected for the analysis. However, it could be more likely
assumed that the mechanism of cell death induced by cuprizone feeding simply
cannot be counteracted by EPO. This is supported by a recent publication, which
showed an advantageous influence of vitamin D3 treatment on demyelination in the
cuprizone model but also failed to demonstrate an effect on mature oligodendocytes
(Wergeland et al, 2011).
It is important to note that the experimental condition (animal model) and exact EPO
application (dose, time point, age of mice) seem to fundamentally influence the
outcome of EPO treatment.
The present study confirmed the known cuprizone-induced upregulation of microglia
within the corpus callosum (Arnett et al, 2001; Gudi et al, 2009; Hiremath et al, 1998;
Lindner et al, 2009; Mason et al, 2004; Merkler et al, 2005; Morell et al, 1998) and
showed that EPO treatment counteracted this effect. Interestingly, this result was
more prominent in the caudal than rostral region of the corpus callosum. A separate
analysis of the rostral and caudal corpus callosum was based on findings of a
different demyelination pattern through the corpus callosum (Stidworthy et al, 2003).
However, no major differences in susceptibility to cuprizone between these two
regions were apparent in the present study. An anti-inflammatory effect of EPO in
oligodendrocyte cultures has been reported before (Genc et al, 2006) and is in
agreement with the general anti-inflammatory effect of EPO in several different
models such as EAE (Agnello et al, 2002; Li et al, 2004), cortical lesions (Sargin et
al, 2009), epilepsy (Jung et al, 2011), closed head injury (Yatsiv et al, 2005) and
ischemia (Villa et al, 2003). The search for further mechanistic insight into EPO
action in the cuprizone model related to cytokines or microglial activity markers failed
to show any clear beneficial effect. This may result from several limitations of the
cuprizone model (as discussed below) and from limitations of the available material
for this analysis. The mRNA analysis was based on whole brain sections from
perfused mice. Either native brain samples and/or a brain region-specific expression
analysis of these markers could show a clearer result in this analysis.
Early axonal degeneration induced by cuprizone could be counteracted by EPO. So
far, an effect of EPO on APP accumulation has not been reported. The EPO effect on
axonal degeneration can either be direct or indirect via a reduction of the number of
microglia. The anti-inflammatory and axon protective effect of EPO may explain, at
least partly, better myelin preservation (%MTR) and better performance in the beam
In summary, this study showed that EPO improved the performance in the beam
balance task and reduced or protected the severe enlargement of the ventricular
system. Additionally, EPO reduced the number of microglia and for the first time, was
found to reduce axonal degeneration in brain white matter tracts.
4.4 Limitations of the model
By carefully reviewing the cuprizone literature, one gets the impression that this
model is well characterized and has only a few limitations. Indeed, the model is well
characterized, especially concerning changes on the immunohistochemical level.
However, in the presented experiments several difficulties became obvious that were
not evident from the literature. (1) The model shows high variability, which became
especially clear not only from the MRI but from the histological analysis as well. High
within-group variability was observed. One reason for the variations could be the
method of cuprizone application. The actual intake of cuprizone is dependent on how
much they eat and therefore can vary a lot between the mice. Moreover, the aspect
that cuprizone might be taken up via skin or respiration is an additional factor which
may further raise the chances of variability. Especially regarding treatment trials, a
high variability means that a high number of mice need to be used for solid
conclusions. The application of cuprizone via injections would be the most precise
method of administration but is not reported so far. (2) The observation of intrinsic
remyelination and a general fast recovery potential by the withdrawal of cuprizone in
this model makes it difficult to predict the optimal time point for investigation. In this
thesis it became clear that some effects of EPO may have been overlooked due to
the possible lack of analyses at the optimal time points. A detailed analysis of a time
series would be necessary but is animal consuming and labor intensive. Moreover,
the fast recovery makes at least the investigation of treatment trials concerning
neuroregeneration difficult. (3) Final conclusions of studies using the cuprizone
model for pharmacological studies are limited because the mechanism of cuprizone
damage on oligodendrocytes is not yet fully understood and subject to investigation
(Liu et al, 2010).
4.5 Final conclusion
As outlined before, there are several limitations of the cuprizone model which should
be carefully considered, especially before using this model for pharmacological trials
in the future. For the first time, different aspects of EPO action on cuprizone-induced
de- and remyelination were investigated in this thesis. In general, repeated cuprizone
feeding was for the first time induced in C57BL/6 mice and showed a physical
robustness (rota-rod and body weight) of the mice at the end-point of the experiment.
However, from the myelin protein analysis, imaging readouts and beam balance
performance, it could be speculated that the recovery potential of the model is either
limited upon repeated cuprizone exposure or still has a high recovery potential. To
clarify this aspect, analyses at several more time points would be needed. No major
EPO effects were found in this experimental set-up. On the other hand, by
investigating the effect of EPO on demyelination, a surprisingly clear protective effect
of EPO was detectable even if not all readouts always reached clear significance.
EPO ameliorated clinical readouts such as beam balance performance and
enlargement of the ventricular system, which may partially be explained by a
reduction of inflammation-associated axonal degeneration in the corpus callosum.
5 LITERATURE
Acs P, Kipp M, Norkute A, Johann S, Clarner T, Braun A, Berente Z, Komoly S, Beyer C
(2009) 17beta-estradiol and progesterone prevent cuprizone provoked demyelination
of corpus callosum in male mice. Glia 57: 807-814
Agnello D, Bigini P, Villa P, Mennini T, Cerami A, Brines ML, Ghezzi P (2002) Erythropoietin
exerts an anti-inflammatory effect on the CNS in a model of experimental
autoimmune encephalomyelitis. Brain Res 952: 128-134
Arishima Y, Setoguchi T, Yamaura I, Yone K, Komiya S (2006) Preventive effect of
erythropoietin on spinal cord cell apoptosis following acute traumatic injury in rats.
Spine (Phila Pa 1976) 31: 2432-2438
Armstrong RC, Le TQ, Flint NC, Vana AC, Zhou YX (2006) Endogenous cell repair of chronic
demyelination. J Neuropathol Exp Neurol 65: 245-256
Arnett HA, Mason J, Marino M, Suzuki K, Matsushima GK, Ting JP (2001) TNF alpha
promotes proliferation of oligodendrocyte progenitors and remyelination. Nat Neurosci
4: 1116-1122
Bakker DA, Ludwin SK (1987) Blood-brain barrier permeability during Cuprizone-induced
demyelination. Implications for the pathogenesis of immune-mediated demyelinating
diseases. J Neurol Sci 78: 125-137
Bartels C, Spate K, Krampe H, Ehrenreich H (2008) Recombinant Human Erythropoietin:
Novel Strategies for Neuroprotective/Neuro-regenerative Treatment of Multiple
Sclerosis. Ther Adv Neurol Disord 1: 193-206
Benetti F, Ventura M, Salmini B, Ceola S, Carbonera D, Mammi S, Zitolo A, D'Angelo P,
Urso E, Maffia M et al (2010) Cuprizone neurotoxicity, copper deficiency and
neurodegeneration. Neurotoxicology 31: 509-517
Bernaudin M, Marti HH, Roussel S, Divoux D, Nouvelot A, MacKenzie ET, Petit E (1999) A
potential role for erythropoietin in focal permanent cerebral ischemia in mice. J Cereb
Blood Flow Metab 19: 643-651
Blakemore WF (1972) Observations on oligodendrocyte degeneration, the resolution of
status spongiosus and remyelination in cuprizone intoxication in mice. J Neurocytol 1:
413-426
Blakemore WF (1973a) Demyelination of the superior cerebellar peduncle in the mouse
induced by cuprizone. J Neurol Sci 20: 63-72
Blakemore WF (1973b) Remyelination of the superior cerebellar peduncle in the mouse
following demyelination induced by feeding cuprizone. J Neurol Sci 20: 73-83
Blakemore WF (1974) Remyelination of the superior cerebellar peduncle in old mice
following demyelination induced by cuprizone. J Neurol Sci 22: 121-126
Boretius S, Kasper L, Tammer R, Michaelis T, Frahm J (2009) MRI of cellular layers in
mouse brain in vivo. Neuroimage 47: 1252-1260
Brines M, Cerami A (2005) Emerging biological roles for erythropoietin in the nervous
system. Nat Rev Neurosci 6: 484-494
Brines M, Grasso G, Fiordaliso F, Sfacteria A, Ghezzi P, Fratelli M, Latini R, Xie QW, Smart
J, Su-Rick CJ et al (2004) Erythropoietin mediates tissue protection through an
erythropoietin and common beta-subunit heteroreceptor. Proc Natl Acad Sci U S A
101: 14907-14912
Brines ML, Ghezzi P, Keenan S, Agnello D, de Lanerolle NC, Cerami C, Itri LM, Cerami A
(2000) Erythropoietin crosses the blood-brain barrier to protect against experimental
brain injury. Proc Natl Acad Sci U S A 97: 10526-10531
Byts N, Siren AL (2009) Erythropoietin: a multimodal neuroprotective agent. Exp Transl
Stroke Med 1: 4
Cammer W (1999) The neurotoxicant, cuprizone, retards the differentiation of
oligodendrocytes in vitro. J Neurol Sci 168: 116-120
diethyldithiocarbamate, alpha-benzoinoxime, and biscyclohexanone oxaldihydrazone.
Toxicol Appl Pharmacol 8: 512-521
Carlton WW (1967) Studies on the induction of hydrocephalus and spongy degeneration by
cuprizone feeding and attempts to antidote the toxicity. Life Sci 6: 11-19
Carlton WW (1969) Spongiform encephalopathy induced in rats and guinea pigs by
cuprizone. Exp Mol Pathol 10: 274-287
Carter RJ, Morton J, Dunnett SB (2001) Motor Coordination and Balance in Rodents. In
Current Protocols in Neuroscience. John Wiley & Sons, Inc.
Chandran P, Upadhyay J, Markosyan S, Lisowski A, Buck W, Chin CL, Fox G, Luo F, Day M
(2011) Magnetic resonance imaging and histological evidence for the blockade of
cuprizone-induced demyelination in C57BL/6 mice. Neuroscience 202: 446-453
Chen SJ, Wang YL, Lo WT, Wu CC, Hsieh CW, Huang CF, Lan YH, Wang CC, Chang DM,
Sytwu HK (2010) Erythropoietin enhances endogenous haem oxygenase-1 and represses
encephalomyelitis. Clin Exp Immunol 162: 210-223
Chen ZY, Asavaritikrai P, Prchal JT, Noguchi CT (2007) Endogenous erythropoietin signaling
is required for normal neural progenitor cell proliferation. J Biol Chem 282: 25875-
25883
Clarner T, Parabucki A, Beyer C, Kipp M (2011) Corticosteroids impair remyelination in the
corpus callosum of cuprizone-treated mice. J Neuroendocrinol 23: 601-611
Crawford DK, Mangiardi M, Xia X, Lopez-Valdes HE, Tiwari-Woodruff SK (2009) Functional
recovery of callosal axons following demyelination: a critical window. Neuroscience
164: 1407-1421
Dame C, Fahnenstich H, Freitag P, Hofmann D, Abdul-Nour T, Bartmann P, Fandrey J
(1998) Erythropoietin mRNA expression in human fetal and neonatal tissue. Blood
92: 3218-3225
Dasgupta S, Mazumder B, Ramani YR, Bhattacharyya SP, Das MK (2011) Evaluation of the
role of erythropoietin and methotrexate in multiple sclerosis. Indian J Pharmacol 43:
512-515
Diem R, Sattler MB, Merkler D, Demmer I, Maier K, Stadelmann C, Ehrenreich H, Bahr M
(2005) Combined therapy with methylprednisolone and erythropoietin in a model of
multiple sclerosis. Brain 128: 375-385
Ehrenreich H, Degner D, Meller J, Brines M, Behe M, Hasselblatt M, Woldt H, Falkai P,
Knerlich F, Jacob S et al (2004) Erythropoietin: a candidate compound for
neuroprotection in schizophrenia. Mol Psychiatry 9: 42-54
Franco-Pons N, Torrente M, Colomina MT, Vilella E (2007) Behavioral deficits in the
cuprizone-induced murine model of demyelination/remyelination. Toxicol Lett 169:
205-213
Fried W (1972) The liver as a source of extrarenal erythropoietin production. Blood 40: 671-
Gao X, Gillig TA, Ye P, D'Ercole AJ, Matsushima GK, Popko B (2000) Interferon-gamma
protects against cuprizone-induced demyelination. Mol Cell Neurosci 16: 338-349
Genc K, Genc S, Baskin H, Semin I (2006) Erythropoietin decreases cytotoxicity and nitric
oxide formation induced by inflammatory stimuli in rat oligodendrocytes. Physiol Res
55: 33-38
Gorio A, Gokmen N, Erbayraktar S, Yilmaz O, Madaschi L, Cichetti C, Di Giulio AM, Vardar
E, Cerami A, Brines M (2002) Recombinant human erythropoietin counteracts
secondary injury and markedly enhances neurological recovery from experimental
spinal cord trauma. Proc Natl Acad Sci U S A 99: 9450-9455
Groebe A, Clarner T, Baumgartner W, Dang J, Beyer C, Kipp M (2009) Cuprizone treatment
induces distinct demyelination, astrocytosis, and microglia cell invasion or
proliferation in the mouse cerebellum. Cerebellum 8: 163-174
Gudi V, Moharregh-Khiabani D, Skripuletz T, Koutsoudaki PN, Kotsiari A, Skuljec J, Trebst
C, Stangel M (2009) Regional differences between grey and white matter in cuprizone
induced demyelination. Brain Res 1283: 127-138
Harsan LA, Steibel J, Zaremba A, Agin A, Sapin R, Poulet P, Guignard B, Parizel N, Grucker
D, Boehm N et al (2008) Recovery from chronic demyelination by thyroid hormone
therapy: myelinogenesis induction and assessment by diffusion tensor magnetic
resonance imaging. J Neurosci 28: 14189-14201
Hibbits N, Pannu R, Wu TJ, Armstrong RC (2009) Cuprizone demyelination of the corpus
callosum in mice correlates with altered social interaction and impaired bilateral sensorimotor coordination. ASN Neuro 1
Hiremath MM, Saito Y, Knapp GW, Ting JP, Suzuki K, Matsushima GK (1998)
Microglial/macrophage accumulation during cuprizone-induced demyelination in
C57BL/6 mice. J Neuroimmunol 92: 38-49
Hoffmann K, Lindner M, Groticke I, Stangel M, Loscher W (2008) Epileptic seizures and
hippocampal damage after cuprizone-induced demyelination in C57BL/6 mice. Exp
Neurol 210: 308-321
Iocca HA, Plant SR, Wang Y, Runkel L, O'Connor BP, Lundsmith ET, Hahm K, van Deventer
HW, Burkly LC, Ting JP (2008) TNF superfamily member TWEAK exacerbates
inflammation and demyelination in the cuprizone-induced model. J Neuroimmunol
194: 97-106
Irvine KA, Blakemore WF (2006) Age increases axon loss associated with primary
demyelination in cuprizone-induced demyelination in C57BL/6 mice. J Neuroimmunol
175: 69-76
Iwai M, Stetler RA, Xing J, Hu X, Gao Y, Zhang W, Chen J, Cao G (2010) Enhanced
oligodendrogenesis and recovery of neurological function by erythropoietin after
neonatal hypoxic/ischemic brain injury. Stroke 41: 1032-1037
Jelkmann W (1992) Erythropoietin: structure, control of production, and function. Physiol Rev
72: 449-489
Jelkmann W (2007) Erythropoietin after a century of research: younger than ever. Eur J
Haematol 78: 183-205
Jewett DL, Williston JS (1971) Auditory-evoked far fields averaged from the scalp of humans.
Brain 94: 681-696
Jung KH, Chu K, Lee ST, Park KI, Kim JH, Kang KM, Kim S, Jeon D, Kim M, Lee SK et al
(2011) Molecular alterations underlying epileptogenesis after prolonged febrile
seizure and modulation by erythropoietin. Epilepsia 52: 541-550
Jung M, Sommer I, Schachner M, Nave KA (1996) Monoclonal antibody O10 defines a
conformationally sensitive cell-surface epitope of proteolipid protein (PLP): evidence
that PLP misfolding underlies dysmyelination in mutant mice. J Neurosci 16: 7920-
7929
Juul SE, Anderson DK, Li Y, Christensen RD (1998) Erythropoietin and erythropoietin
receptor in the developing human central nervous system. Pediatr Res 43: 40-49
Kang SY, Kang JH, Choi JC, Lee JS, Lee CS, Shin T (2009) Expression of erythropoietin in
the spinal cord of lewis rats with experimental autoimmune encephalomyelitis. J Clin
Neurol 5: 39-45
Kesterson JW, Carlton WW (1970) Aqueductal stenosis as the cause of hydrocephalus in
mice fed the substituted hydrazine, cuprizone. Exp Mol Pathol 13: 281-294
Kesterson JW, Carlton WW (1971) Histopathologic and enzyme histochemical observations
of the cuprizone-induced brain edema. Exp Mol Pathol 15: 82-96
Klingmuller U (1997) The role of tyrosine phosphorylation in proliferation and maturation of
erythroid progenitor cells--signals emanating from the erythropoietin receptor. Eur J
Biochem 249: 637-647
Kondo A, Nakano T, Suzuki K (1987) Blood-brain barrier permeability to horseradish
peroxidase in twitcher and cuprizone-intoxicated mice. Brain Res 425: 186-190
Konishi Y, Chui DH, Hirose H, Kunishita T, Tabira T (1993) Trophic effect of erythropoietin
and other hematopoietic factors on central cholinergic neurons in vitro and in vivo.
Brain Res 609: 29-35
Koury MJ, Bondurant MC, Graber SE, Sawyer ST (1988) Erythropoietin messenger RNA
levels in developing mice and transfer of 125I-erythropoietin by the placenta. J Clin
Invest 82: 154-159
Koutsoudaki PN, Skripuletz T, Gudi V, Moharregh-Khiabani D, Hildebrandt H, Trebst C,
Stangel M (2009) Demyelination of the hippocampus is prominent in the cuprizone
model. Neurosci Lett 451: 83-88
Kubicki M, McCarley RW, Shenton ME (2005) Evidence for white matter abnormalities in
schizophrenia. Curr Opin Psychiatry 18: 121-134
Kumar S, Biancotti JC, Yamaguchi M, de Vellis J (2007) Combination of growth factors
enhances remyelination in a cuprizone-induced demyelination mouse model.
Neurochem Res 32: 783-797
Kumral A, Baskin H, Yesilirmak DC, Ergur BU, Aykan S, Genc S, Genc K, Yilmaz O, Tugyan
K, Giray O et al (2007) Erythropoietin attenuates lipopolysaccharide-induced white
matter injury in the neonatal rat brain. Neonatology 92: 269-278
Leist M, Ghezzi P, Grasso G, Bianchi R, Villa P, Fratelli M, Savino C, Bianchi M, Nielsen J,
Gerwien J et al (2004) Derivatives of erythropoietin that are tissue protective but not
erythropoietic. Science 305: 239-242
Li L, Jiang Q, Ding G, Zhang L, Zhang ZG, Li Q, Panda S, Kapke A, Lu M, Ewing JR et al
(2009) MRI identification of white matter reorganization enhanced by erythropoietin
treatment in a rat model of focal ischemia. Stroke 40: 936-941
Li W, Maeda Y, Yuan RR, Elkabes S, Cook S, Dowling P (2004) Beneficial effect of
erythropoietin on experimental allergic encephalomyelitis. Ann Neurol 56: 767-777
Liebetanz D, Merkler D (2006) Effects of commissural de- and remyelination on motor skill
behaviour in the cuprizone mouse model of multiple sclerosis. Exp Neurol 202: 217-
224
Lim KO, Hedehus M, Moseley M, de Crespigny A, Sullivan EV, Pfefferbaum A (1999)
Compromised white matter tract integrity in schizophrenia inferred from diffusion
tensor imaging. Arch Gen Psychiatry 56: 367-374
Lin W, Kemper A, Dupree JL, Harding HP, Ron D, Popko B (2006) Interferon-gamma inhibits
central nervous system remyelination through a process modulated by endoplasmic
reticulum stress. Brain 129: 1306-1318
Linares D, Taconis M, Mana P, Correcha M, Fordham S, Staykova M, Willenborg DO (2006)
Neuronal nitric oxide synthase plays a key role in CNS demyelination. J Neurosci 26:
12672-12681
Lindner M, Fokuhl J, Linsmeier F, Trebst C, Stangel M (2009) Chronic toxic demyelination in
the central nervous system leads to axonal damage despite remyelination. Neurosci
Lett 453: 120-125
Lindner M, Heine S, Haastert K, Garde N, Fokuhl J, Linsmeier F, Grothe C, Baumgartner W,
Stangel M (2008) Sequential myelin protein expression during remyelination reveals
fast and efficient repair after central nervous system demyelination. Neuropathol Appl
Neurobiol 34: 105-114
Liu L, Belkadi A, Darnall L, Hu T, Drescher C, Cotleur AC, Padovani-Claudio D, He T, Choi
K, Lane TE et al (2010) CXCR2-positive neutrophils are essential for cuprizone-
induced demyelination: relevance to multiple sclerosis. Nat Neurosci 13: 319-326
Liu W, Shen Y, Plane JM, Pleasure DE, Deng W (2011) Neuroprotective potential of
erythropoietin and its derivative carbamylated erythropoietin in periventricular
leukomalacia. Exp Neurol 230: 227-239
Liu ZY, Chin K, Noguchi CT (1994) Tissue specific expression of human erythropoietin
receptor in transgenic mice. Dev Biol 166: 159-169
Logue SF, Owen EH, Rasmussen DL, Wehner JM (1997) Assessment of locomotor activity,
acoustic and tactile startle, and prepulse inhibition of startle in inbred mouse strains
and F1 hybrids: implications of genetic background for single gene and quantitative
trait loci analyses. Neuroscience 80: 1075-1086
Love S (1988) Cuprizone neurotoxicity in the rat: morphologic observations. J Neurol Sci 84:
Ludwin SK (1978) Central nervous system demyelination and remyelination in the mouse: an
ultrastructural study of cuprizone toxicity. Lab Invest 39: 597-612
Makinodan M, Yamauchi T, Tatsumi K, Okuda H, Takeda T, Kiuchi K, Sadamatsu M,
Wanaka A, Kishimoto T (2009) Demyelination in the juvenile period, but not in
adulthood, leads to long-lasting cognitive impairment and deficient social interaction
in mice. Prog Neuropsychopharmacol Biol Psychiatry 33: 978-985
Mana P, Linares D, Fordham S, Staykova M, Willenborg D (2006) Deleterious role of
IFNgamma in a toxic model of central nervous system demyelination. Am J Pathol
168: 1464-1473
Marti HH (2004) Erythropoietin and the hypoxic brain. J Exp Biol 207: 3233-3242
Marti HH, Wenger RH, Rivas LA, Straumann U, Digicaylioglu M, Henn V, Yonekawa Y,
Bauer C, Gassmann M (1996) Erythropoietin gene expression in human, monkey and
murine brain. Eur J Neurosci 8: 666-676
Mason JL, Jones JJ, Taniike M, Morell P, Suzuki K, Matsushima GK (2000) Mature
oligodendrocyte apoptosis precedes IGF-1 production and oligodendrocyte progenitor
accumulation and differentiation during demyelination/remyelination. J Neurosci Res
61: 251-262
Mason JL, Langaman C, Morell P, Suzuki K, Matsushima GK (2001a) Episodic
demyelination and subsequent remyelination within the murine central nervous
system: changes in axonal calibre. Neuropathol Appl Neurobiol 27: 50-58
Mason JL, Suzuki K, Chaplin DD, Matsushima GK (2001b) Interleukin-1beta promotes repair
of the CNS. J Neurosci 21: 7046-7052
Mason JL, Toews A, Hostettler JD, Morell P, Suzuki K, Goldman JE, Matsushima GK (2004)
Oligodendrocytes and progenitors become progressively depleted within chronically
demyelinated lesions. Am J Pathol 164: 1673-1682
Masuda S, Okano M, Yamagishi K, Nagao M, Ueda M, Sasaki R (1994) A novel site of
erythropoietin production. Oxygen-dependent production in cultured rat astrocytes. J
Biol Chem 269: 19488-19493
Matsushima GK, Morell P (2001) The neurotoxicant, cuprizone, as a model to study
demyelination and remyelination in the central nervous system. Brain Pathol 11: 107-
116
McMahon EJ, Cook DN, Suzuki K, Matsushima GK (2001) Absence of macrophage-
inflammatory protein-1alpha delays central nervous system demyelination in the
presence of an intact blood-brain barrier. J Immunol 167: 2964-2971
Merkler D, Boretius S, Stadelmann C, Ernsting T, Michaelis T, Frahm J, Bruck W (2005)
Multicontrast MRI of remyelination in the central nervous system. NMR Biomed 18:
395-403
Messori L, Casini A, Gabbiani C, Sorace L, Muniz-Miranda M, Zatta P (2007) Unravelling the
chemical nature of copper cuprizone. Dalton Trans: 2112-2114
Mitelman SA, Brickman AM, Shihabuddin L, Newmark RE, Hazlett EA, Haznedar MM,
Buchsbaum MS (2007) A comprehensive assessment of gray and white matter
volumes and their relationship to outcome and severity in schizophrenia. Neuroimage
37: 449-462
Miyake T, Kung CK, Goldwasser E (1977) Purification of human erythropoietin. J Biol Chem
252: 5558-5564
Mizuno K, Hida H, Masuda T, Nishino H, Togari H (2008) Pretreatment with low doses of
erythropoietin ameliorates brain damage in periventricular leukomalacia by targeting
late oligodendrocyte progenitors: a rat model. Neonatology 94: 255-266
Moharregh-Khiabani D, Blank A, Skripuletz T, Miller E, Kotsiari A, Gudi V, Stangel M (2010)
Effects of fumaric acids on cuprizone induced central nervous system de- and
remyelination in the mouse. PLoS One 5: e11769
Morell P, Barrett CV, Mason JL, Toews AD, Hostettler JD, Knapp GW, Matsushima GK
(1998) Gene expression in brain during cuprizone-induced demyelination and
remyelination. Mol Cell Neurosci 12: 220-227
Morishita E, Masuda S, Nagao M, Yasuda Y, Sasaki R (1997) Erythropoietin receptor is
expressed in rat hippocampal and cerebral cortical neurons, and erythropoietin
prevents in vitro glutamate-induced neuronal death. Neuroscience 76: 105-116
Nagai A, Nakagawa E, Choi HB, Hatori K, Kobayashi S, Kim SU (2001) Erythropoietin and
erythropoietin receptors in human CNS neurons, astrocytes, microglia, and
oligodendrocytes grown in culture. J Neuropathol Exp Neurol 60: 386-392
Nave KA (2010) Myelination and support of axonal integrity by glia. Nature 468: 244-252
Nilsson G (1950) A New Colour Reaction on Copper and Certain Carbonyl Compounds. Acta
Chemica Scandinavica 4: 205
Noguchi CT, Asavaritikrai P, Teng R, Jia Y (2007) Role of erythropoietin in the brain. Crit Rev
Oncol Hematol 64: 159-171
Norkute A, Hieble A, Braun A, Johann S, Clarner T, Baumgartner W, Beyer C, Kipp M (2009)
Cuprizone treatment induces demyelination and astrocytosis in the mouse
hippocampus. J Neurosci Res 87: 1343-1355
Pasquini LA, Calatayud CA, Bertone Una AL, Millet V, Pasquini JM, Soto EF (2007) The
neurotoxic effect of cuprizone on oligodendrocytes depends on the presence of pro-
inflammatory cytokines secreted by microglia. Neurochem Res 32: 279-292
Pattison IH, Jebbett JN (1971) Histopathological similarities between scrapie and cuprizone
toxicity in mice. Nature 230: 115-117
Pattison IH, Jebbett JN (1973) Clinical and histological recovery from the scrapie-like
spongiform encephalopathy produced in mice by feeding them with cuprizone. J
Pathol 109: 245-250
Peterson RE, Bollier ME (1955) Spectrophotometric Determination of Serum Copper with
Biscyclohexanoneoxalyldihydrazone. Analytical Chemistry 27: 1195-1197
Radyushkin K, El-Kordi A, Boretius S, Castaneda S, Ronnenberg A, Reim K, Bickeboller H,
Frahm J, Brose N, Ehrenreich H (2010) Complexin2 null mutation requires a 'second
hit' for induction of phenotypic changes relevant to schizophrenia. Genes Brain Behav
9: 592-602
Remington LT, Babcock AA, Zehntner SP, Owens T (2007) Microglial recruitment, activation,
and proliferation in response to primary demyelination. Am J Pathol 170: 1713-1724
Sakanaka M, Wen TC, Matsuda S, Masuda S, Morishita E, Nagao M, Sasaki R (1998) In
vivo evidence that erythropoietin protects neurons from ischemic damage. Proc Natl
Acad Sci U S A 95: 4635-4640
Sargin D, Friedrichs H, El-Kordi A, Ehrenreich H (2010) Erythropoietin as neuroprotective
and neuroregenerative treatment strategy: Comprehensive overview of 12 years of
preclinical and clinical research. Best Pract Res Clin Anaesthesiol 24: 573-594
Sargin D, Hassouna I, Sperling S, Siren AL, Ehrenreich H (2009) Uncoupling of
neurodegeneration and gliosis in a murine model of juvenile cortical lesion. Glia 57:
693-702
Sasaki R, Masuda S, Nagao M (2001) Pleiotropic functions and tissue-specific expression of
erythropoietin. News Physiol Sci 16: 110-113
Sattler MB, Merkler D, Maier K, Stadelmann C, Ehrenreich H, Bahr M, Diem R (2004)
Neuroprotective effects and intracellular signaling pathways of erythropoietin in a rat
model of multiple sclerosis. Cell Death Differ 11 Suppl 2: S181-192
Savino C, Pedotti R, Baggi F, Ubiali F, Gallo B, Nava S, Bigini P, Barbera S, Fumagalli E,
Mennini T et al (2006) Delayed administration of erythropoietin and its non-
erythropoietic derivatives ameliorates chronic murine autoimmune encephalomyelitis.
J Neuroimmunol 172: 27-37
Shingo T, Sorokan ST, Shimazaki T, Weiss S (2001) Erythropoietin regulates the in vitro and
in vivo production of neuronal progenitors by mammalian forebrain neural stem cells.
J Neurosci 21: 9733-9743
Siren AL, Ehrenreich H (2001) Erythropoietin--a novel concept for neuroprotection. Eur Arch
Psychiatry Clin Neurosci 251: 179-184
Siren AL, Knerlich F, Poser W, Gleiter CH, Bruck W, Ehrenreich H (2001) Erythropoietin and
erythropoietin receptor in human ischemic/hypoxic brain. Acta Neuropathol 101: 271-
276
Skripuletz T, Bussmann JH, Gudi V, Koutsoudaki PN, Pul R, Moharregh-Khiabani D, Lindner
M, Stangel M (2010a) Cerebellar cortical demyelination in the murine cuprizone
model. Brain Pathol 20: 301-312
Skripuletz T, Lindner M, Kotsiari A, Garde N, Fokuhl J, Linsmeier F, Trebst C, Stangel M
(2008) Cortical demyelination is prominent in the murine cuprizone model and is
strain-dependent. Am J Pathol 172: 1053-1061
Skripuletz T, Miller E, Moharregh-Khiabani D, Blank A, Pul R, Gudi V, Trebst C, Stangel M
(2010b) Beneficial effects of minocycline on cuprizone induced cortical demyelination.
Neurochem Res 35: 1422-1433
Song SK, Yoshino J, Le TQ, Lin SJ, Sun SW, Cross AH, Armstrong RC (2005)
Demyelination increases radial diffusivity in corpus callosum of mouse brain.
Neuroimage 26: 132-140
Stidworthy MF, Genoud S, Suter U, Mantei N, Franklin RJ (2003) Quantifying the early
stages of remyelination following cuprizone-induced demyelination. Brain Pathol 13:
329-339
Sugawa M, Sakurai Y, Ishikawa-Ieda Y, Suzuki H, Asou H (2002) Effects of erythropoietin on
glial cell development; oligodendrocyte maturation and astrocyte proliferation.
Neurosci Res 44: 391-403
Sun SW, Liang HF, Trinkaus K, Cross AH, Armstrong RC, Song SK (2006) Noninvasive
detection of cuprizone induced axonal damage and demyelination in the mouse
corpus callosum. Magn Reson Med 55: 302-308
Suzuki K, Kikkawa Y (1969) Status spongiosus of CNS and hepatic changes induced by
cuprizone (biscyclohexanone oxalyldihydrazone). Am J Pathol 54: 307-325
Taylor LC, Puranam K, Gilmore W, Ting JP, Matsushima GK (2010) 17beta-estradiol
protects male mice from cuprizone-induced demyelination and oligodendrocyte loss.
Neurobiol Dis 39: 127-137
Thorne M, Moore CS, Robertson GS (2009) Lack of TIMP-1 increases severity of
experimental autoimmune encephalomyelitis: Effects of darbepoetin alfa on TIMP-1
null and wild-type mice. J Neuroimmunol 211: 92-100
Torkildsen O, Brunborg LA, Milde AM, Mork SJ, Myhr KM, Bo L (2009a) A salmon based diet
protects mice from behavioural changes in the cuprizone model for demyelination.
Clin Nutr 28: 83-87
Torkildsen O, Brunborg LA, Thorsen F, Mork SJ, Stangel M, Myhr KM, Bo L (2009b) Effects
of dietary intervention on MRI activity, de- and remyelination in the cuprizone model
for demyelination. Exp Neurol 215: 160-166
Tsai PT, Ohab JJ, Kertesz N, Groszer M, Matter C, Gao J, Liu X, Wu H, Carmichael ST
(2006) A critical role of erythropoietin receptor in neurogenesis and post-stroke
recovery. J Neurosci 26: 1269-1274
Uranova NA, Vikhreva OV, Rachmanova VI, Orlovskaya DD (2011) Ultrastructural
Alterations of Myelinated Fibers and Oligodendrocytes in the Prefrontal Cortex in Schizophrenia: A Postmortem Morphometric Study. Schizophrenia Research and Treatment 2011
Vandesompele J, De Preter K, Pattyn F, Poppe B, Van Roy N, De Paepe A, Speleman F
(2002) Accurate normalization of real-time quantitative RT-PCR data by geometric
averaging of multiple internal control genes. Genome Biol 3: RESEARCH0034
Venturini G (1973) Enzymic activities and sodium, potassium and copper concentrations in
mouse brain and liver after cuprizone treatment in vivo. J Neurochem 21: 1147-1151
Villa P, Bigini P, Mennini T, Agnello D, Laragione T, Cagnotto A, Viviani B, Marinovich M,
Cerami A, Coleman TR et al (2003) Erythropoietin selectively attenuates cytokine
production and inflammation in cerebral ischemia by targeting neuronal apoptosis. J
Exp Med 198: 971-975
Vitellaro-Zuccarello L, Mazzetti S, Madaschi L, Bosisio P, Gorio A, De Biasi S (2007)
Erythropoietin-mediated preservation of the white matter in rat spinal cord injury.
Neuroscience 144: 865-877
Voss EV, Skuljec J, Gudi V, Skripuletz T, Pul R, Trebst C, Stangel M (2012) Characterisation
of microglia during de- and remyelination: can they create a repair promoting
environment? Neurobiol Dis 45: 519-528
Wergeland S, Torkildsen O, Myhr KM, Aksnes L, Mork SJ, Bo L (2011) Dietary vitamin D3
supplements reduce demyelination in the cuprizone model. PLoS One 6: e26262
Werner SR, Saha JK, Broderick CL, Zhen EY, Higgs RE, Duffin KL, Smith RC (2010)
Proteomic analysis of demyelinated and remyelinating brain tissue following dietary
cuprizone administration. J Mol Neurosci 42: 210-225
Wetlesen CU (1957) Rapid spectrophotometric determination of copper in iron, steel and
ferrous alloys. Analytica Chimica Acta 16: 268-270
Xiao L, Xu H, Zhang Y, Wei Z, He J, Jiang W, Li X, Dyck LE, Devon RM, Deng Y et al (2008)
Quetiapine facilitates oligodendrocyte development and prevents mice from myelin
breakdown and behavioral changes. Mol Psychiatry 13: 697-708
Xu H, Yang HJ, McConomy B, Browning R, Li XM (2010) Behavioral and neurobiological
changes in C57BL/6 mouse exposed to cuprizone: effects of antipsychotics. Front
Behav Neurosci 4: 8
Xu H, Yang HJ, Rose GM, Li XM (2011) Recovery of behavioral changes and compromised
white matter in C57BL/6 mice exposed to cuprizone: effects of antipsychotic drugs.
Front Behav Neurosci 5: 31
Xu H, Yang HJ, Zhang Y, Clough R, Browning R, Li XM (2009) Behavioral and
neurobiological changes in C57BL/6 mice exposed to cuprizone. Behav Neurosci
123: 418-429
Yamada M, Burke C, Colditz P, Johnson DW, Gobe GC (2011) Erythropoietin protects
against apoptosis and increases expression of non-neuronal cell markers in the
hypoxia-injured developing brain. J Pathol 224: 101-109
Yang HJ, Wang H, Zhang Y, Xiao L, Clough RW, Browning R, Li XM, Xu H (2009) Region-
specific susceptibilities to cuprizone-induced lesions in the mouse forebrain:
Implications for the pathophysiology of schizophrenia. Brain Res 1270: 121-130
Yatsiv I, Grigoriadis N, Simeonidou C, Stahel PF, Schmidt OI, Alexandrovitch AG, Tsenter J,
Shohami E (2005) Erythropoietin is neuroprotective, improves functional recovery,
and reduces neuronal apoptosis and inflammation in a rodent model of experimental
closed head injury. FASEB J 19: 1701-1703
Youssoufian H, Longmore G, Neumann D, Yoshimura A, Lodish HF (1993) Structure,
function, and activation of the erythropoietin receptor. Blood 81: 2223-2236
Yu X, Shacka JJ, Eells JB, Suarez-Quian C, Przygodzki RM, Beleslin-Cokic B, Lin CS,
Nikodem VM, Hempstead B, Flanders KC et al (2002) Erythropoietin receptor
signalling is required for normal brain development. Development 129: 505-516
Yuan R, Maeda Y, Li W, Lu W, Cook S, Dowling P (2008) Erythropoietin: a potent inducer of
peripheral immuno/inflammatory modulation in autoimmune EAE. PLoS One 3: e1924
Zanjani ED, Poster J, Burlington H, Mann LI, Wasserman LR (1977) Liver as the primary site
of erythropoietin formation in the fetus. J Lab Clin Med 89: 640-644
Zatta P, Raso M, Zambenedetti P, Wittkowski W, Messori L, Piccioli F, Mauri PL, Beltramini
M (2005) Copper and zinc dismetabolism in the mouse brain upon chronic cuprizone
treatment. Cell Mol Life Sci 62: 1502-1513
Zhang J, Li Y, Cui Y, Chen J, Lu M, Elias SB, Chopp M (2005) Erythropoietin treatment
improves neurological functional recovery in EAE mice. Brain Res 1034: 34-39
Zhang L, Chopp M, Zhang RL, Wang L, Zhang J, Wang Y, Toh Y, Santra M, Lu M, Zhang ZG
(2010) Erythropoietin amplifies stroke-induced oligodendrogenesis in the rat. PLoS
One 5: e11016
Zhang Y, Xu H, Jiang W, Xiao L, Yan B, He J, Wang Y, Bi X, Li X, Kong J et al (2008)
Quetiapine alleviates the cuprizone-induced white matter pathology in the brain of
C57BL/6 mouse. Schizophr Res 106: 182-191
6 SUPPLEMENT
6.1 Certificate of the toxicological analysis of cuprizone pellets
6.2 Accepted first-author and co-author publications
6.2.1 Publication of first-authorship 1
Nora Hagemeyer, Susann Boretius, Christoph Ott, Axel von Streitberg, Henrike
Welpinghus, Swetlana Sperling, Jens Frahm, Mikael Simons, Pietro Ghezzi,
Hannelore Ehrenreich (2012). Erythropoietin attenuates neurological and histological
consequences of toxic demyelination in mice. Molecular Medicine, [Epub ahead of
Due to copyright reasons, please check the journals homepage:
6.2.2 Publication of first-authorship 2
Nora Hagemeyer*, Sandra Goebbels*, Sergi Papiol*, Anne Kästner, Sabine Hofer,
Martin Begemann, Ulrike C. Gerwig, Susann Boretius, Georg L. Wieser, Anja
Ronnenberg, Artem Gurvich, Stephan H. Heckers, Jens Frahm, Klaus-Armin Nave ,
Hannelore Ehrenreich (2012). A myelin gene causative of a catatonia-depression
syndrome upon aging. EMBO Molecular Medicine 4, 6.
*These authors contributed equally to this work
Due to copyright reasons, please check the journals homepage:
6.2.3 Publication of co-authorship 1
Hannes Treiber, Nora Hagemeyer, Hannelore Ehrenreich, Mikael Simons (2011).
BACE1 in central nervous system myelination revisited. Molecular Psychiatry 17, 3.
Due to copyright reasons, please check the journals homepage:
6.2.4 Publication of co-authorship 2
Bartosz Adamcio, Swetlana Sperling, Nora Hagemeyer, Gail Walkinshaw and
Hannelore Ehrenreich (2010). Hypoxia inducible factor stabilization leads to lasting
improvement of hippocampal memory in healthy mice. Behavioural Brain Research
Due to copyright reasons, please check the journals homepage:
6.3 Curriculum vitae
Personal data
Max Planck Institute of Experimental Medicine
Hermann-Rein-Straße 3
37075 Göttingen
Göttingen, Germany
[email protected]
Education
PhD student - Center for Systems Neuroscience, Graduate School for
Neuroscience and Molecular Biosciences, Göttingen, Germany
Supervisor: Prof. H. Ehrenreich, Division of Clinical Neuroscience, Max
Planck Institute of Experimental Medicine, Göttingen, Germany
Diploma in Biology, University of Bremen, Germany
German „Abitur" at the Georg-Christoph-Lichtenberg Gesamtschule,
Göttingen, Germany
Source: http://www.znv.de/materials/hagemeyer.pdf
REGULATIONS AND SYLLABUS BACHELOR OF PHARMACY (B.PHARM) COURSE JSS UNIVERSITY SRI SHIVARATHREESHWARA NAGAR MYSORE – 570 015 JSS University Sri Shivarathreeshwara Nagar Mysore – 570 015 Bachelor of Pharmacy (B.Pharm) course REGULATIONS These regulations shall be called as "The Regulations for the B. Pharmacy Degree course of the J.S.S. University, Mysore". They shall come into force from the Academic Year 2012 - 2013. The regulations framed are subject to modifications from time to time by the authorities of the university Minimum qualification for admission to the course
DIAGNOSTIC AUTOMATION, INC. 23961 Craftsman Road, Suite D/E/F, Calabasas, CA 91302 Tel: (818) 591-3030 Fax: (818) 591-8383 [email protected] www.rapidtest.com See external label Enzyme Immunoassay for the Quantitative Determination of Chloramphenicol in Food Cat #5126-8 Recovery (spiked samples)