Automated dynamic fedbatch process and media optimization for high productivity cell culture process development

Automated Dynamic Fed-Batch Process andMedia Optimization for High Productivity CellCulture Process Development
Franklin Lu,1 Poh Choo Toh,2 Iain Burnett,1 Feng Li,1 Terry Hudson,1Ashraf Amanullah,1 Jincai Li11Oceanside Pharma Technical Development, Genentech, Inc., 1 Antibody Way, Oceanside,California 92056; telephone: þ(86)21-50462814; fax: þ(86)21-50461000;e-mail: [email protected] Technology Institute, Singapore 138668, Singapore
KEYWORDS: CHO cell culture; fed-batch; dynamic feeding;
ABSTRACT: Current industry practices for large-scale
capacitance; automated sampling; Nova Flex
mammalian cell cultures typically employ a standard plat-form fed-batch process with fixed volume bolus feeding.
Although widely used, these processes are unable to respondto actual nutrient consumption demands from the culture,
which can result in accumulation of by-products and deple-tion of certain nutrients. This work demonstrates the appli-
Several different modes of bioreactor operations have
cation of a fully automated cell culture control, monitoring,
traditionally been used to optimize production processes
and data processing system to achieve significant produc-
and maximize titer for monoclonal antibody production.
tivity improvement via dynamic feeding and media optimi-
Methods have varied from the simple batch and fed-batch
zation. Two distinct feeding algorithms were used todynamically alter feed rates. The first method is based
process to the more complex continuous culture or
upon on-line capacitance measurements where cultures
perfusion culture (Bibila and Robinson, 1995). Among
were fed based on growth and nutrient consumption rates
these approaches, fed-batch processes are the most widely
estimated from integrated capacitance. The second method
employed due to their ease of operation, flexibility, and
is based upon automated glucose measurements obtained
robustness. In these fed-batch processes, high monoclonal
from the Nova Bioprofile FLEX1 autosampler where cul-tures were fed to maintain a target glucose level which in
antibody yields of up to 10 g/L have been achieved through
turn maintained other nutrients based on a stoichiometric
feeding enhancement and optimization, which increase cell
ratio. All of the calculations were done automatically
productivity, maintain cell viability, and extend culture
through in-house integration with a Delta V process control
longevity (Huang et al., 2010; Yu et al., 2011). These
system. Through both media and feed strategy optimization,
strategies typically involve feeding cultures with a concen-
a titer increase from the original platform titer of 5 to 6.3 g/Lwas achieved for cell line A, and a substantial titer increase of
trated feed media either daily, continuously or at fixed
4 to over 9 g/L was achieved for cell line B with comparable
intervals with fixed feed volumes. However, this strategy
product quality. Glucose was found to be the best feed
does not take into consideration the variation in growth and
indicator, but not all cell lines benefited from dynamic
nutrient requirements that can occur in different cell lines or
feeding and optimized feed media was critical to process
even with the same cell line due to biological variability
improvement. Our work demonstrated that dynamic feed-ing has the ability to automatically adjust feed rates accord-
which in turn can lead to nutrient depletion or accumula-
ing to culture behavior, and that the advantage can be best
tion of by-products in the culture.
realized during early and rapid process development stages
Dynamic feeding on the other hand has been utilized as a
where different cell lines or large changes in culture condi-
method to adapt a process to the real time nutrient demand
tions might lead to dramatically different nutrient demands.
of cells through a variety of feeding algorithms (Wlaschin
Biotechnol. Bioeng. 2013;110: 191–205.
and Hu, 2006; Zhang et al., 2004). Early efforts in dynamic
ß 2012 Wiley Periodicals, Inc.
feeding largely focused on maintaining the cultures at a lowglucose and/or glutamine level in order to reduce by-product accumulation, in particular lactate and ammonia,
Correspondence to: J. LiReceived 5 August 2011; Revision received 22 June 2012; Accepted 26 June 2012
while also trying to balance overall nutrient demand (Gong
Accepted manuscript online 5 July 2012;
et al., 2006; Kuwae et al., 2005; Sauer et al., 2000). This was
Article first published online 1 September 2012 in Wiley Online Library
achieved by growth and nutrient consumption modeling,
coupled with more frequent manual sampling, calculation
ß 2012 Wiley Periodicals, Inc.
Biotechnology and Bioengineering, Vol. 110, No. 1, January, 2013
and manual feeding (Xie and Wang, 1994a,b). Additionally,
measurement is advantageous as an indicator for dynamic
Zhou (1994) and Zhou et al. (1995) established automated
fed-batch process due to its continuous on-line signal and
oxygen uptake rate (OUR) measurement, and used that to
does not require any multivariate chemometric analysis
estimate glucose consumption via the assumed stoichio-
(Junker and Wang, 2006; Kiviharju et al., 2008; Teixeira
metric ratio between glucose and oxygen, and then fed
et al., 2009), thus simplifying the integration into feed
accordingly to maintain a low glucose level. However,
algorithms. We also demonstrate the use of an automated
periodic manual sampling for glucose measurement was
on-line sampler to measure viable cell counts and glucose at
required to adjust the glucose to oxygen ratio as it varied
pre-determined intervals which could then in turn be used
during the course of the culture. Other efforts included
by the bioreactor control system to modulate the feed rate of
measuring and monitoring single specific nutrients, for
a complex stoichiometrically balanced feed. Previous
example, glutamine, with an automated aseptic online
methods of dynamic feeding have all required user
sampling loop, and feeding glutamine accordingly to
intervention to manually adjust feed rates making these
maintain a low level (Chee Furng Wong et al., 2005; Lee
types of experiments labor intensive to implement into
et al., 2003). More recently, dynamic feeding based on the
widespread development (Yu et al., 2011), but a fully
manual calculation of integral viable cell concentration has
automated system makes an adaptive platform feasible. We
been demonstrated to produce an optimized process
present two different models of control, a predictive method
with titers above 10 g/L (Huang et al., 2010). In all cases,
used to estimate future nutrient demand based on past
better growth and productivity were demonstrated with
consumption and growth, and a feedback mechanism used
successful control of the by-products lactate and ammonia.
to maintain the setpoint of an indicator metabolite. Both of
However, these feeding strategies are still very labor
these methods use a feed that balances key components
intensive involving frequent sampling, recalculation, and
relative to one another through an iterative analysis of
manual adjustments.
nutrient consumption. Taken together, we aim to demon-
In spite of the various successful applications, dynamic
strate a rapid, systematic method of cell culture process
feeding as a process development platform has not been
development and optimization with the capability to rapidly
explored extensively. Dynamic feeding has the benefit of
develop high titer processes.
adapting the feed strategy simultaneously with the evalua-tion of other process changes to reach an optimal process
Materials and Methods
with significantly fewer experiments. For instance, atraditional problem with the use of a predefined platform
Cell Line and Culture Conditions
during clone selection is that with a fixed feed strategy, theclone that best fits the platform will be chosen as opposed to
Two recombinant CHO cell lines, cell line A and cell line B,
the clone with the best potential. Alternatively, by allowing
expressing two distinct IgG antibodies were maintained as
the process to adapt to the growth and consumption of each
continuous seed trains in a proprietary serum-free medium
individual clone, the most efficient path to the optimal clone
under selective pressure of either methotrexate or methio-
and process can be achieved simultaneously. In addition,
nine sulfoximine. The cells were passaged every 3–4 days in
due to further developments in the technology of on-line
shake flasks at a seeding density of 0.3E6 cells/mL. These
probes, bioreactor control systems, and automated sampling
seed train cultures were kept in incubators controlled at
equipment it is of interest to evaluate such industrial
378C and 5% carbon dioxide, and were shaken at a speed of
platform processes with a completely automated dynamic
150 rpm. The inoculum for the production cultures were
fed-batch process. These advancements can supplement
cultivated in 3 L bioreactors (Applikon, Foster City, CA)
existing process measurements and adapt the cultures based
without selective pressure with a starting densities of 0.8 to
on real-time nutrient demand.
1E6 cells/mL controlled at 378C at pH 7 (Mettler Toledo,
In this work we demonstrate several distinct methods of
Bedford, MA) and 30% dissolved oxygen (DO; Broadley
on-line measurements in order to determine a dynamic feed
James, Irvine, CA) with an agitation of 275 rpm. Fed batch
rate for optimal cell culture protein productivity including
production cultures were seeded from inoculum cultures at
capacitance and online measurements of viable cell density
1.0 to 2.0E6 cells/mL in a proprietary chemically defined
and glucose. Capacitance measurement has previously been
medium without selective pressure. These cultures were
proven to be a useful tool in providing real-time biomass
controlled at the same conditions as the inoculum cultures
monitoring in fed-batch fermentations (Arnoux et al., 2005)
except for the temperature setpoint, which was shifted from
and cell culture (Opel et al., 2010). Capacitance measure-
37 to 358C on Day 2 or 3 of the production culture. For the
ments have also been successfully employed to obtain online
initial baseline studies and improved feed testing, glucose
cell concentration for feed rate calculations in the fed-batch
was supplemented separately from the rest of the feed
fermentation of Monascus sp. for yellow pigment produc-
solution as a 500 g/L solution when the glucose concentra-
tion (Krairak et al., 2000). In this work we incorporate the
tion decreased to below 3 g/L. For later glucose feedback
use of capacitance measurements as a surrogate for cell
experiments, the glucose was incorporated into the feed
growth to dynamically determine feed rate through a
solution. The culture duration for these fed-batch processes
completely automated, predictive method. Capacitance
ranged between 14 and 20 days.
Biotechnology and Bioengineering, Vol. 110, No. 1, January, 2013
Cell Culture Media
where R1 is the nutrient consumption rate defined inEquation (1), IVCþ1 is the predicted integral of viable cell
All media for the fed-batch processes were proprietary and
concentration (or surrogate such as integrated capacitance),
chemically defined. The feed medium was optimized as
from the current time to the next timepoint, V0 is the
discussed in the Results Section. Basal media was pH and
current volume of the culture, and YS is the desired
osmolality adjusted before use. Feed media was formulated
setpoint of the nutrient concentration. The final term,
without pH and osmolality adjustment.
Y0V0 � ðYSV0Þ, represents a correction factor to adjust feedvolume in the case that the predicted nutrient consumption
Fed-Batch Process
rate is inaccurate.
The standard fed-batch production process used a bolus
For glucose-based autosampler feedback, a separate
feed addition at 10% (or 5% with concentrated feed
algorithm was used in order to simplify the feed method.
medium) of culture volume, every 3 days starting on Day 3.
At each sample point, an amount of feed was added to the
Initial experiments continued the bolus feed until Day 9 but
culture to bring the glucose concentration to a target level as
later fed batch experiments with optimized feed medium
described by Equation (3)
continued the feeds every 3 days until the end of the culture.
Pumps were calibrated before each run through Delta V
(Emerson, St. Louis, MO), and the feed source was placed
on scale to monitor accuracy of additions. The dynamic
¼ target glucose ðg=LÞ � measured glucose ðg=LÞ 0 mL
glucose concentration in feed ðg=LÞ
fed batch algorithm employed in the experiments was setup through customized Delta V software. This algorithm
enabled the culture to be fed based on one of two methods, apredictive method or a feedback-based algorithm. In the
For viable cell concentration (VCC) based autosampler
predictive method, the viable cell density was monitored
feedback cases, the calculation was based on a pre-
using a BioProfile FLEX1 (Nova Biomedical, Waltham,
determined per cell consumption rate and concentration
MA) automated cell counter or using the capacitance probe.
of asparagine in the feed, as described by Equation (4).
At predetermined intervals, the current measure of the celldensity (X0), either from trypan blue counts or capacitance,and the previous measure of cell density (X
mL to add ¼ ½VCC� � V
0 � R=Freq � ½Asn�
to calculate a specific growth rate to predict the future celldensity or capacitance (Xþ1). The predicted future valuecould then be used to determine a future integrated
VCC : cell count ðcells=mLÞ
capacitance or integrated viable cell count. A nutrient
V0 : culture volume ðmLÞ
consumption rate (R
R : asparagine consumption rateðmmol asn=cell dayÞ
1) could then be calculated using
the current nutrient concentration (Y
Freq : sampling frequency ð1=dayÞ
0), previous nutrient
concentration (Y�
Asn : asparagine feed concentrationðmmol asn=mLÞ
1), previous feed volume ( F�1), feed
concentration (Yc), current tank volume (V0), and previoustank volume (V�1) to determine the total amount of feed percell per unit time required as shown by Equation (1)
In Process and Offline Measurements
Nutrient consumption rate
Online capacitance (Fogale Biotech, Cambridge, MA)readings were taken continuously during the runs of the
¼ previous � current þ fed ¼ Y�1V�1 � Y0V0 þ F�1YC
predictive model to facilitate the feeding algorithm. The
capacitance reading was taken directly from the probe
measurement with parameters set as described in Opel et al.
Alternatively, nutrient consumption rates from previous
(2010) and every 4 h these readings were used as described in
experiments could be used as estimates. Once the nutrient
the fed-batch process above. The offline VCC, viability,
consumption rate was determined, the final feed rate could
pH, ammonia, osmolality, pCO2, pO2, Caþþ, Kþ, Naþ,
be calculated by Equation (2):
glutamine, glutamate, glucose and lactate were all moni-tored using a BioProfile FLEX1 (Nova Biomedical).
Autosamplers were setup and cleaned as described in
Feed volume ¼ predicted consumption ðmmolÞ
concentration in feed ðmmol=mLÞ where
Derfus et al. (2009). Amino acid analysis and vitamin
predicted consumption ¼ consumption rate
analyses (by high performance liquid chromatography,HPLC), as well as trace element analysis (by inductively
� predicted IVC � ðcurrent nutrient concentration
coupled plasma mass spectrometry, ICP-MS) were also
� desired nutrient concentrationÞ
performed after each experiment. Titer was measured
¼ ðR1IVCþ1Þ � ðY0V0 � ðYSV0ÞÞ
through HPLC with Protein A columns.
Lu et al.: Automated Dynamic Fed-Batch Process and Media Optimization
Biotechnology and Bioengineering
Antibody Product Quality Analysis
defined feed media and to evaluate the impact of feedtiming. The cultures were fed with the same feed medium,
The product quality attributes of antibodies, including level
either by bolus feeding (10% of working volume on Day 2, 5,
of aggregation, acidic and basic variants, and various
and 8), daily feeding (adjusted daily based on VCC), or
glycoforms were measured and compared. The various
continuous feeding (1.8 mL/L/h starting at Day 2). All cases
product quality analysis methods were previously described
were designed to deliver similar total feed volumes (Fig. 1F)
(Li et al., 2012).
and resulted in similar growth and titer profiles (Fig. 1A andB). This initial data suggested that when the total amount ofnutrients is controlled, a variety of feed timings and volumescould still be used to produce comparable results. While
Errors, Uncertainties, and Reproducibility of Results
growth and titer were not impacted by feed timing, amino
Most data presented here are from representative singlet
acid time course profiles revealed that all three cultures were
conditions as the overall effort was an iterative process so
exhausted or limited in several key nutrients including
each experiment varied slightly. Error bars presented are
cysteine, asparagine, and tyrosine during the late stage of the
based on error of analytical measurements only and are
run (Fig. 1C–E) which may have led to slowed product
described in each corresponding figure. We feel confident in
accumulation during the late stage of the culture.
the results and general applicability of the method, as severalsets of iterative conditions were studied. We saw similarimprovements in two cell lines (Fig. 9) with three different
Feed Media Design and Optimization
on-line inputs (capacitance, glucose, and OUR) and theperformance trend was consistent throughout the optimi-
The platform feed medium was redesigned and refined after
zation process (Table I).
several experiments according to the flow chart shown inFigure 2 to obtain a stoichiometrically balanced feedmedium. For this iterative method, several experiments
were required in order to assess the effectiveness of thefeeding method for maintaining consistent nutrientconsumption rates since adjustment of the feed could
Baseline Data (Platform Feed Formulation,
potentially change the relative consumption rates. Daily
amino acid concentrations were used to calculate daily
In order to provide baseline data, cell lines A and B were
consumption rates that were then averaged to determine
evaluated in a standard fed-batch process as described in the
an overall consumption rate. The relative ratios for all
Materials and Methods Section. These cell lines were chosen
components of the feed medium were then normalized to an
due to their high titer and high nutrient consumption rates
indicator metabolite. When cultures were fed based on the
in order to maximize the potential improvements of
indicator metabolite, other components were supplemented
dynamic feeding. The results of cell line A are shown in
in stoichiometric amounts to avoid exhaustion or over
Figure 1. Nutrient data was also collected in the initial
accumulation. In these studies, asparagine was selected
baseline experiments in order to redesign the chemically
as one benchmark metabolite because of its role as one
Evolution of feed media.
Feed concentration of
unlisted metabolites
Zinc sulfate (mg/L)
Ferric citrate (mg/L)
Other amino acids
1.4� leucine, lysine, serine
Glycine, threonine, valine,
(others unchanged)
isoleucine, leucine, serine 1.8–2.5�
of CDF1 (others 1.5� of CDF1)
Osmolality (mOsm/kg)
Titer (cell line B)a
4.1 � 0.2 (3 feeds to Day 9)
6.0 � 0.3 (3 feeds to Day 9)
7.0 � 0.4 (5 feeds to Day 14)
8.6 � 0.4; 9.1 � 0.5
aTiter ranges (�t) are based on analytical error.
Biotechnology and Bioengineering, Vol. 110, No. 1, January, 2013
Figure 1. Three cultures of cell line A, designed to receive about the same volume of a chemically defined feed formulation (CDF1) were evaluated with either bolus feeding(10% WV on Day 2, 5, 8), daily feeding (adjusted daily based on VCC), or continuous feeding (1.8 mL/L/h starting at Day 2). A: VCC; (B) titer profiles of baseline fed-batch runs weresimilar independent of feeding method; (C) asparagine; (D) tyrosine; (E) cystine amino acid profiles indicating nutrient limitation in later part of culture; and (F) total feed volumeprofile. Error bars are based on analytical accuracy of measurements: VCC � 5%, titer � 5%, amino acids � 5%, and feed volume (by weight) � 5 g.
of the key energy sources in the tricarboxylic acid (TCA)
The evolution of the feed media is described in Table I. As
cycle and its relatively consistent consumption rate
shown in Figure 1, cultures with the initial platform feed
throughout our baseline study cultures. In addition,
showed depletion of several amino acids. Therefore, the
asparagine is regarded as a key amino acid for product
original platform feed was adjusted with higher levels of
synthesis, as depletion of asparagine had been shown to
asparagine, tyrosine, leucine, lysine, and serine to create
lead to decreases in cell specific productivity (unpublished
chemically defined feed #1 (CDF1). In addition, zinc and
observations). Other metabolites such as glucose were
iron levels were also increased in CDF1. With CDF1, the
also used as an indicator due to its key role as a primary
culture was able to maintain appropriate levels of most of
energy source.
the amino acids, for example, asparagine, tyrosine, serine,
Lu et al.: Automated Dynamic Fed-Batch Process and Media Optimization
Biotechnology and Bioengineering
and isoleucine. However, the total feed volume increasedabout 40% compared to the control culture (data notshown), resulting in significant dilution and thus limitingincrease of volumetric productivity. The majority of the feedcomponents were then concentrated by 2� in order tominimize dilution effects, and relative ratios were furtheradjusted (chemically defined feed #2, CDF2). CDF2 wastested for cell line B with asparagine as indicator metabolite,and average asparagine consumption rate from platformbolus feed culture was used as pre-determined nutrientconsumption rate. However, significant accumulation ofasparagine as well as serine and isoleucine was observed, asactual asparagine consumption rate on cell line B culturewas lower than predicted. The overall concentration of thefeed medium was then lowered slightly to 1.5� of CDF1 andratios of several components were further refined forthe final version, chemical defined feed #3 (CDF3), toaccommodate the changes in consumption rates. This
Figure 2. Iterative method of a complex stoichiometrically balanced feed.
resulted in balanced nutrient profiles, as shown in Figure 3of asparagine, tyrosine, serine, and isoleucine profiles.
In addition, vitamin and trace metals profiles were alsomonitored and adjustments were made throughout the feedmedium optimization (data not shown). The titer results in
Figure 3. Amino acid profiles of (A) asparagine, (B) serine, (C) tyrosine, and (D) isoleucine during dynamic feeding with evolved feed medias CDF1, CDF2, and CDF3 with bothcell line A and B. Error bars are based on analytical accuracy of measurements: amino acids � 5%. GTR (greater than measurement range of 10 mM).
Biotechnology and Bioengineering, Vol. 110, No. 1, January, 2013
Table I showed the performance improvement trends for cell
that of the typical PID control. Two primary advancements
line B throughout the optimization process.
were key to these developments: the integration of on-lineprocess monitoring which was able to provide realtime analysis of key variables (i.e., capacitance) and theautomation of at-line sampling that is typically done by
Design of Dynamic Feeding algorithm
hand by researchers using Nova Bioprofile Automated
Two different types of dynamic feeding algorithms were
Sampler system. In collaboration with Nova Biomedical, we
employed in this work. The predictive method utilized an
were able to build a custom OPC module to read additional
online indicator of cell growth and calculated the expected
parameters that could be measured on an adaptable
growth rate and cell density in order to estimate future
nutrient demand. The alternative approach was a feedback-
Figure 4 depicts the set up of the automated fed-batch
based approach in which the historical nutrient consump-
process. Initially, a signal (capacitance, OD, OUR, cell
tion is used to determine amount of feed to maintain an
count, or glucose) was collected in order to assess the
indicator metabolite at a target. With the automated
current state of the bioreactor. Once the current state of the
sampling method, the sampling interval is set frequent
bioreactor had been assessed, previous data could also be
enough (�6 h) to avoid dramatic changes in cell mass and
used to predict future nutrient demand. In the case of
the target concentration is set high enough to avoid
capacitance, the specific growth rate was coupled with a
exhaustion between feeding intervals. In either method,
predetermined nutrient consumption rate to account for
dynamic feeding is not being used in a nutrient limited
changes in cell mass before the next feed point. Finally, after
mode to alter metabolism, but solely as a means to
each pre-determined interval, the feed pump was activated
determine how much and how often to feed, which may
to supply the required volume of feed.
avoid potential changes in product quality due to altered
In order to account for noise and aberrant readings,
metabolism (Chee Furng Wong et al., 2005). In addition,
correction factors were incorporated into both algorithms.
the dynamic feed was restricted to small bolus feeds that
For the predictive methods an additional term were built in
occurred several times a day. Consequently, nutrient
to the algorithms to handle over or underfeeding (the
composition was never fully static, but was controlled
second term of Equation 2).For the feedback method, the
within desired ranges to optimize productivity.
response to fluctuation is built into the feedback control so
One of the key advancements of this work was integration
that if at any one data point, an excess of feed is added, the
of our feeding algorithms into our control system. Delta V is
feed volume added will be reduced or eliminated upon
a process control platform that can be easily scaled for large
the next measurement. Neither of these algorithms are able
bioreactor networks. In this work, we were able to build
to immediately discard an errant data point, which is a
custom modules within the control system that linked to
weakness of the system, as an incorrect measurement could
novel inputs to build an additional layer of control beyond
lead to a large spike of unneeded feed. While not
Figure 4. Design of automated dynamic feeding system.
Lu et al.: Automated Dynamic Fed-Batch Process and Media Optimization
Biotechnology and Bioengineering
implemented for these experiments, a criteria could be
productivity profiles (Fig. 5A and B). Ammonium increased
implemented that would trigger a re-calibration and
more rapidly in late phase of the dynamic feeding culture
recalculation of feed addition if, for instance, the calculated
(Fig. 5C), potentially due to higher levels of asparagine
consumption rate changed more drastically than expected.
available, which may have resulted in higher rate of
These sort of error checks would be simple for an automated
deamidation to aspartatic acid. Asparagine concentration
method to incorporate once bi-directional communication
was well maintained throughout the cultures, although there
with analytical instruments is enabled. Currently, this is
were more day-to-day changes for the bolus feeding case
possible with the Nova Flex and was in development at the
compared to the dynamic feeding case (Fig. 5D). Other
time of this work.
nutrient and metabolism profiles were also similar betweenthe two cultures (data not shown). Titer reached 6.1 and6.3 g/L for the bolus and dynamic feeding cases, respectively,
Capacitance Based Predictive Method Using Optimized
which represents about 25% increase when compared to the
Feed Medium: Cell Line A
platform bolus feeding cultures shown in Figure 1. Theimprovement in titer appeared to be primarily due to
The automated system described above was first attempted
optimization of feed formulation and cell line A was not
using the predictive model with online capacitance
sensitive to the feeding frequency using the optimized feed
measurement. In addition, the feed medium formulation
was optimized from the original platform feed medium afterseveral iterative experiments. Figure 5 shows the resultsusing the optimized feed medium CDF3 for cell line A. The
Capacitance Based Predictive Method Using Optimized
dynamic feed was based on capacitance measurement and
Feed Medium: Cell Line B
was added every 4 h. A bolus feed culture was also performedfor comparison, where a feed volume of 5% initial culture
The capacitance-based dynamic feeding method was also
volume was delivered every 3 days until Day 15. Overall, the
applied to cell line B with the same optimized feed medium
dynamic feeding case and the manual bolus feeding case had
CDF3. Cell line B had marked difference on growth and
very similar performance, as shown by the growth and
nutrient consumption rates compared to cell line A (data
Figure 5. Two cultures of cell line A were tested with optimized feed medium (CDF3) using either the standard bolus feeding method (5% every 72 h) or using the dynamicfeeding method with capacitance as on-line feedback signal (fed every 4 h). Comparison of (A) VCC, (B) titer, (C) ammonium, and (D) asparagine profiles. Error bars are based onanalytical accuracy of measurements: VCC � 5%, titer � 5%, ammonium � 5%, and amino acids � 5%.
Biotechnology and Bioengineering, Vol. 110, No. 1, January, 2013
not shown), and thus the pre-determined feeding rate had to
and physiological state in addition to biomass (Opel et al.,
be adjusted for each cell line. Specifically, the asparagine feed
2010). Titer was also dramatically improved with the
rate was reduced by about 30% to account for lower specific
optimized feed formulation. Combined with dynamic
asparagine consumption rate. For the control case, manual
feeding, cultures were able to reach titers up to 8.6 g/L, a
bolus feeding was done every 3 days at 5% initial culture
two-fold improvement over the baseline process (Fig. 6C).
volume using the same CDF3 feed medium. The results are
Cell specific productivity was similar during the early stage
shown in Figure 6. In addition, results from the original
of culture, and the capacitance based predictive method
platform bolus feed culture are also depicted in Figure 6 for
maintained productivity at higher levels and for a longer
period than bolus feeds (Fig. 6D). The bolus feed case with
Cell growth was significantly higher in the dynamic
the same optimized feed was also improved from the
feeding case than both the improved bolus feed case and the
baseline, reaching 7 g/L titer, indicating that the rebalancing
initial platform bolus feed case (Fig. 6A). Peak density was
of the feed as well as higher inoculation density were also
reached around Day 8 in both improved bolus feed and
significant contributions to the increase in titer. However,
dynamic feeding cases. Osmolality was maintained below
even in the optimized bolus feed case shown here, rapid
400 mOsm/kg at the end of the culture, indicating absence of
changes of over 50 mOsm/kg still occurred after each
significant metabolite accumulation (Fig. 6B). Capacitance
bolus feed, potentially negatively impacting growth and
profiles tracked closely with offline VCC values until peak
productivity relative to the dynamic feeding case. In
VCC was reached. Capacitance then continued to increase
addition, the total feed volume was not controlled as in
for several days before beginning to decrease around Day 11.
the baseline studies. The dynamic feed culture actually used
The divergence between capacitance and VCC profiles had
approximately 50% more total feed volume (Fig. 6E) over
been reported previously, as capacitance depends on cell size
the entire culture duration compared to the bolus feed
Figure 6. Two cultures of cell line B were tested with CDF3 using either the standard bolus feeding method (5% every 72 h) or using the dynamic feeding method withcapacitance as on-line feedback signal (fed every 4 h). Both cultures also incorporated a higher inoculation density of 2e�6 cells/mL to increase build up of cell mass. The platformbolus feed process (with initial platform feed medium and lower inoculation density) is shown for reference: (A) VCC (solid symbols) and capacitance (open symbols) profiles, steepdrops in capacitance profile in the optimized bolus case were due to volume changes due to feeds; (B) osmolality profiles, (C) titer, (D) average specific productivity, (E) total feedvolumes, and (F) asparagine concentration profiles. Error bars are based on analytical accuracy of measurements: VCC � 5%, osmolality � 5 mOsm, titer � 5%, specificproductivity � 7% (based on propagation of error), feed volume (by weight) � 5 g, and amino acids � 5%.
Lu et al.: Automated Dynamic Fed-Batch Process and Media Optimization
Biotechnology and Bioengineering
culture, although no amino acids dropped below detectablelevels (0.2 mM) in either case. While the lack of nutrientexhaustion demonstrated the successful redesign of the feedformulation using the iterative method (Fig. 6F), it alsoindicated that feeding the additional volume in the dynamicfeeding case led to greater nutrient consumption andincreased antibody production. These differences under-score the possibilities that different feed algorithms canresult in alternative feed volumes that could result in evenhigher titers. Consequently, simply searching for nutrientexhaustion might not be sufficient to determine when aprocess has reached an optimal feed regime.
A key aspect of process improvement is product quality.
Differences in product quality have been observed inprevious applications of dynamic feeding that was focusedon altering cellular metabolism to improve processproductivity (Chee Furng Wong et al., 2005). However,in our case our feeding algorithms are not designed tooperate in nutrient limited mode, but to more efficientlypredict the demand of the culture and adjust feed accordingto shifts in cell density and cell physiology. Consequently, inour cases only minor differences in key product qualityattributes were observed that were all within acceptableranges for typical molecules (Fig. 7).
Autosampler Based Feedback Control Method UsingOptimized Feed Medium: Cell Line B
As an alternative to a predictive model of nutrient demandused in previous studies, we explored a direct feedbackmechanism where feed rates were altered dynamically tomaintain a preset target of an indicator metabolite. From thelimited number of metabolites directly measured by theBioProfile FLEX instrument, glucose was chosen as a keyindicator of metabolism. Glucose has the advantage of beinga direct indicator of nutrient consumption that inherently
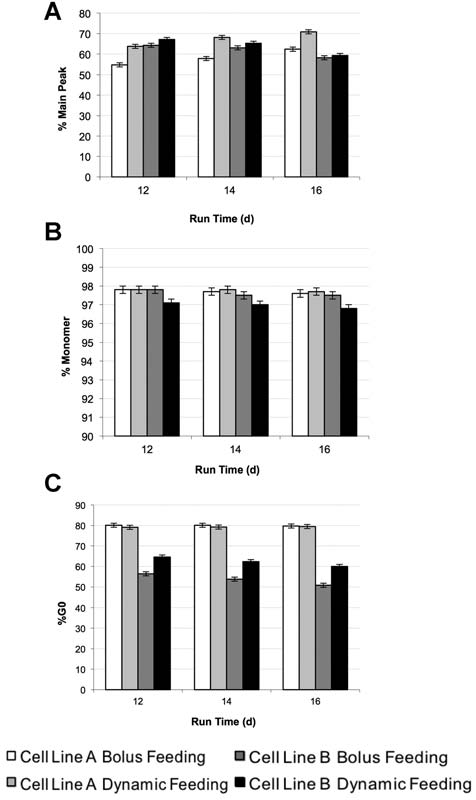
Figure 7. Product quality comparison between dynamic feeding and bolus
incorporates changes in cell growth and volumetric
feeding cases. A: %Main peak of charged variants as measured by iCIEF at Day12, 14, and 16 using the capacitance based predictive method for the two test cell lines.
consumption rate. From the capacitance based predictive
B: %Monomer analysis of product by size exclusion chromatography, (C) %GO glycan
dynamic feeding study, it was observed that there was a
analysis by capillary electrophoresis. Error bars are based on analytical accuracy of
relatively constant ratio between glucose consumption rate
measurements: monomer � 0.2%, charge variants � 1%, and glycoforms � 1%.
and the asparagine consumption rate throughout theculture. This suggested that glucose could be a surrogateindicator for the previously asparagine balanced feed
this method, additional components could be modified or
formulation (CDF3) to dynamically feed the cultures.
added easily to a chemically defined feed as long as they are
Feed rate in glucose feedback control is determined by
balanced relative to other nutrients based on their
Equation (3) described in the Materials and Methods and by
consumption rates.
in-process glucose measurements. The glucose feedback
Figure 8 shows the results of the autosampler based
method benefits from incorporating multiple sources of
dynamic feed back control study. In addition to feeding
variability such as changes in cell mass and metabolism into
based on the measured glucose concentration, VCC was also
a single direct input that could be used to determine the feed
used as a feeding indicator in this same study. For the
glucose-based feeding, the target glucose level was set at 5 g/L,
The feed medium used in this study had one change from
which was chosen based on previous capacitance based
CDF3, which was used in the experiment described in
feeding study. For the VCC-based feeding, feed rate was
Figure 6. Glucose, which had previously been added
calculated automatically according to Equation (4) in the
separately as a second feed, was added to the feed medium
Materials and Methods Section. In addition, a fourth case
and balanced stoichiometrically with other metabolites. The
from a separate experiment, labeled as ‘‘Manual adjusted
rest of the CDF3 composition remained unchanged. With
feed, every 6 h'' was also included for comparison, where the
Biotechnology and Bioengineering, Vol. 110, No. 1, January, 2013
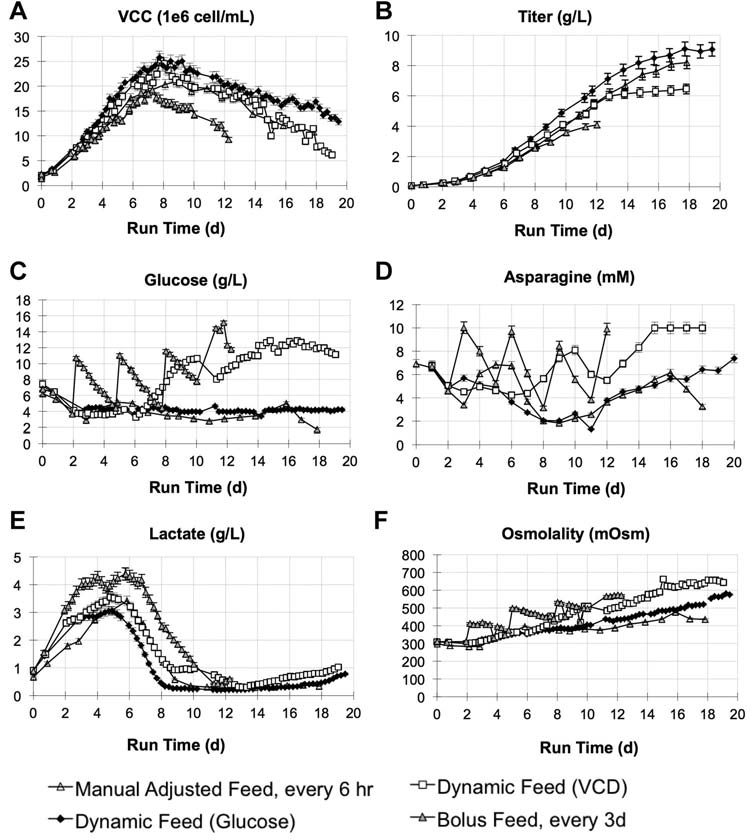
Figure 8. Auto sampler based dynamic feeding results of cell line B. Cultures were inoculated at initial VCC of 2.0e�6/mL and feeding with CDF3 was initiated on Day 2. For theglucose and VCC-based feeding, cultures were sampled every 6 h via the autosampler, and fed automatically based on Equations (3) and (4) after each sampling. A fourth case froma separate experiment, labeled as ‘‘manual adjusted feed, every 6 h'' was also included for comparison, where the feed medium was also delivered every 6 h, but no auto samplerwas used and feed volume was preset once a day based on off-line glucose measurement. The daily adjustment on feed volume was done to target culture glucose level of between4 and 6 g/L. The bolus feed case was fed every 3 days at 6.7% initial culture volume. A: VCC and (B) titer profiles indicating cell mass and productivity improved with glucosefeedback. C: Glucose and (D) asparagine profiles illustrating direct and indirect metabolite control through dynamic feeding. E: lactate and (F) osmolality profiles. Error bars arebased on analytical accuracy of measurements: VCC � 5%, titer � 5%, glucose � 0.2 g/L, asparagine � 5%, lactate � 5%, and osmolality � 5 mOsm.
feed medium was delivered in the same frequency as with the
nutrient accumulation (Fig. 8C, D, and F). This may be due
glucose based feeding, that is, every 6 h. But no auto sampler
to the fact that VCC is an indirect indicator of nutrient
was used and feed volume was adjusted only once a day
consumption and the total cell mass may not be an accurate
based on off-line glucose measurement so that the same
indicator of changing metabolic activity. As a result, the
feed volume would be used four times before the next
continual overfeeding and resulting osmolality increases
adjustment. The daily adjustment on feed volume was done
may have led to more rapid reduction in VCC (Fig. 8A) and
to target culture glucose level of between 4 and 6 g/L. The
reduced productivity. The bolus feeding case (fed every
design can be interpreted as manual dynamic feeding.
3 days at 6.7% initial culture volume) did not perform as
The highest titer of 9.1 g/L was achieved using the glucose
well in this study, with culture viability dropping to <60%
feedback method (Fig. 8B). In the auto sampler based VCC
by Day 12 and titer reaching 4.1 g/L. Compared to the bolus
feedback case, glucose, osmolality, and asparagine levels
feeding case in Figure 5 where titer reached 7 g/L, a key
were increasing late in the culture, indicating potential
difference between the two cultures was the increased feed
Lu et al.: Automated Dynamic Fed-Batch Process and Media Optimization
Biotechnology and Bioengineering
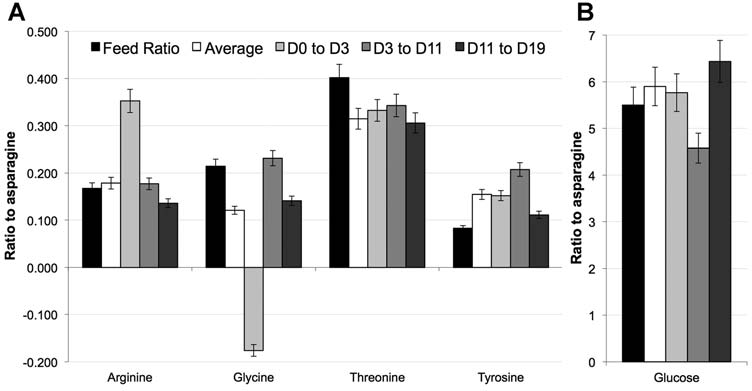
Figure 9. A: Ratio of feed concentrations and consumption rates of arginine, glycine, threonine, and tyrosine relative to feed concentration and consumption rates ofasparagine in feed versus consumption rates in various stages of culture for auto sampler based glucose feedback culture: (black) indicates ratio in feed medium, (white) indicatesconsumption rate across entire run, (light gray) consumption rate from Day 0 to Day 3, (gray) consumption rate from Day 3 to Day 11 and (dark gray) consumption rates from Day 12to Day 19 based on amino acid analysis of cell culture supernatants by HPLC. B: Ratio of glucose feed concentrations and consumption rates to asparagine feed concentrations andconsumption rates for auto sampler based glucose feedback case. Error bars are based on analytical accuracy of measurements and propogation of error: amino acids ratio � 7%,glucose ratio � 6.7% (based on glucose error of 0.2 g/L and average glucose measurement of 4.5 g/L).
volume from 5% to 6.7% initial culture volume per feed,
with the objective of increasing total feed volume to matchthe dynamic feeding case. However, the bolus feed case
Most industrial mammalian cell culture processes still use
might have suffered from apparent high osmolality and high
manual bolus feeding methods for nutrient feeding (Kelley,
nutrient concentration shock accompanied by each feed, as
2009). This is in contrast to an industrial microbial
each bolus feed added about 100 mOsmo to the culture
fermentation process where automatic, dynamic feeding
(Fig. 8F). The fourth case with the daily manual adjusted
often is necessary to avoid nutrient over-accumulation and
feed rate performed quite well, reaching titer of 8.2 g/L,
waste product formation. Examples include widely used
which was only slightly lower than the 9.1 g/L reached by the
dissolved oxygen (DO-stat) or pH (pH-stat) based feeding
glucose-based dynamic feeding case and comparable with
strategies for E. coli fermentation (Chen et al., 1997; Kim
the 8.6 g/L reached by the capacitance-based dynamic
et al., 2004). The difference in practice is largely due to the
feeding case in Figure 6.
fast metabolism of microbial cells in comparison to
When looking at the metabolite and nutrient profiles, the
mammalian cells and hence the perception that mammalian
glucose feedback case and the daily manual adjusted case
cultures do not need to be fed so frequently. In this work,
tracked very closely in glucose, lactate, asparagine, and
part of our objective was to understand whether given the
osmolality (Fig. 8C–F). In contrast, the VCC-based dynamic
same feed medium, the feeding strategy and frequency
feeding case and the bolus feed case both had higher glucose,
difference would lead to different culture performance.
asparagine, and osmolality levels.
Little has been reported on such comparison studies. In their
Even with glucose as a direct indicator of metabolism, the
work, Po¨rtner et al. (2004) did compare the various control
relative consumption rates of other components varied
and feed strategies for a hybridoma cell line expressing a
during the culture, and in some cases the overall
Mab. However, the studies with the various feed strategies
consumption rates also differed slightly than predicted
were not conducted in parallel; rather they were done over
from previous studies (Fig. 9A and B). For instance, the
several years, when specific Mab productivity varied
average consumptions rate (white bar) of arginine and
significantly. The feed medium used for the studies also
glucose matched well with the ratios predicted in feed
varied slightly. Thus strict comparison on productivity
formulation (black bars), but other components such as
across the different methods was not possible. Many other
tyrosine and glycine showed slight differences from expected
reports compared performance between batch culture and
relative consumption. In addition, as expected, the relative
optimized fed-batch culture, but again not among fed-batch
consumption rates also varied throughout the length of the
culture modes with the same feed medium (Xie and Wang,
culture from relatively minor changes of glucose to more
1994a,b, 1996; Xie et al., 1997; Yu et al., 2011; Zhou et al.,
dramatic shifts of components such as glycine.
1995, 1997). To our knowledge, our work is the first that
Biotechnology and Bioengineering, Vol. 110, No. 1, January, 2013
Summary of comparisons between preset bolus feed and automatic dynamic feed cultures.
Bolus (daily adjusted)
1.91 (1.18 on Day 12)
6.5 (5.4 on Day 12)
640 (395 on Day 12)
1.64 (1.01 on Day 12)
9.1 �0.5 (6.3 � 0.3 Day 12)
Bolus (daily adjusted)
530 (335 on Day 12)
1.36 (0.86 on Day 12)
8.2 � 0.4 (5.4 � 0.3 Day 12)
aAdjusted based on 1.45 L initial culture volume, �5 g.
bTiter ranges (�5%) are based on analytical error.
cNutrient depletion seen on all three cultures.
dBolus feed rate changed from 5% to 6.7%. High nutrient accumulation, high osmolality seen on the culture with bolus, every 3-day feeding, which resulted
in early termination of bolus culture.
eThe glucose concentration was adjusted to 133 g/L (739 mM) in CDF3 for this experiment to combine a previously separate glucose and nutrient feed into
one solution.
offers direct comparison between manual bolus feeding and
noted, however, that for manual bolus feeding to work
automatic dynamic feeding with industrially relevant and
optimally, appropriate feed dose, and feeding frequency still
high producing cell lines. We offered four sets of data
need to be established for different cell lines and processes.
(Figs. 1, 5, 6, and 8) across two cell lines for the direct
This is especially true for highly concentrated feed medium,
comparison. Table II summarized the studies by highlight-
for example, CDF3, where feeding in every 3 days at 5%
ing the feeding strategy, frequency and total feed volume.
initial volume seemed not enough for cell line B, and feeding
Each set of the studies used exactly the same feed medium,
in every 3 days at 6.7% initial volume resulted in large
with the only difference being feeding strategy and
osmolality and nutrient shock.
frequency. The studies shown in Figures 1 and 5 show
In essence, the key advantage of dynamic feeding, when
basically identical performance between manual bolus
coupled with feedback control, is the ability to automatically
feeding and dynamic feeding for cell line A, whereas studies
adjust feed rates according to culture behavior, aka, feed by
on Figures 6 and 8 show higher titer with the dynamic
demand, thus avoiding either under-feeding or over-feeding
feeding case than the bolus feeding case for cell line B.
of the cultures. The advantage can be best realized during
Consequently, improvements from dynamic feeding will
early and rapid process development stages where different
vary based on relative sensitivity of cell line, which may be a
cell lines or large changes in culture conditions might lead to
combination of sensitivity to large shifts in osmolality from
dramatically different nutrient demands, making it impos-
bolus feeds and sensitivity to variations in metabolites that
sible to determine feed rates beforehand. Conversely, once a
may alter nutrient uptake and metabolism. For some cell
process is well established, a fixed rate, predefined bolus
lines, such as cell line A, this difference may be negligible.
feeding method could very well deliver similar performance.
An interesting observation from this work was that the
The actual dynamic feed profiles (Figs. 1F and 6E) of this
relative performance among the cases appear to be
work appear to be relatively constant, where a continuous
correlated with total feed volume, with the total feed
feed could also potentially replicate results while simplifying
volume approximately the same between the feeding
implementation. However, these simplifications require first
methods for Figure 1 studies and Figure 5 studies,
performing dynamic feeding experiment to determine the
respectively, whereas for Figure 6 studies, feed volume
appropriate feed rate. In addition, even in well established
was about 1.5� higher with the dynamic feeding case. This
manufacturing processes, the bolus strategy does not take
suggests that it is possible to achieve similar culture
into consideration the variation in growth and nutrient
performance when similar volumes of feed are delivered via
requirements that can occur due to variations in parameters
different feeding methods. Consequently, with further
like inoculation density, raw materials or cell age, which in
adjustments a manual bolus feed could potentially achieve
turn can lead to nutrient depletion, or accumulation of by-
the same titer as a dynamic feed with cell line B. However,
products in the culture.
two key points need to be considered a priori. The total
In our efforts, we evaluated both the capacitance-based
bolus feed volume would need to be predetermined, and the
predictive method and the auto sampler-based feedback
frequency of bolus feeding needs to be optimized for
control method. Similar performance was achieved between
different feed medium and different processes. It should be
the two methods. The predictive method requires accurate
Lu et al.: Automated Dynamic Fed-Batch Process and Media Optimization
Biotechnology and Bioengineering
modeling of culture growth rates or nutrient consumption
The authors are grateful for the valuable contributions and technical
rates (Dowd et al., 2001a,b; Kurokawa et al., 1994; Xie and
discussions by Srikanth Chary, Gayle Derfus, Veronica Carvalhal,
Wang, 1994a,b). However, since growth rates and nutrient
Jason Goodrick, and Robert Kiss.
consumption rates vary during the course of any givenculture, which have impact on specific substrate uptakerates, an on-line or off-line measurement is needed to either
automatically or manually adjust feed rates. In our work, thecapacitance signal was successfully used as a surrogate of
Arnoux AS, Preziosi-Belloy L, Esteban G, Teissier P, Ghommidh C. 2005.
culture growth, and constant re-calculation of growth rates
Lactic acid bacteria biomass monitoring in highly conductive media bypermittivity measurements. Biotechnol Lett 27(20):1551–1557.
was done automatically to allow for change of feed rates.
Bibila TA, Robinson DK. 1995. In pursuit of the optimal fed-batch process
The asparagine consumption rate, used as an indicator
for monoclonal antibody production. Biotechnol Prog 11(1):1–13.
metabolite for feed rate calculation, was initially derived
Chee Furng Wong D, Tin Kam Wong K, Tang Goh L, Kiat Heng C, Gek Sim
from historical data and then adjusted throughout evolution
Yap M. 2005. Impact of dynamic online fed-batch strategies on
of the feed medium formulations. On the other hand, the
metabolism, productivity and N-glycosylation quality in CHO cellcultures. Biotechnol Bioeng 89(2):164–177.
feedback-based method does not rely on growth or nutrient
Chen W, Graham C, Ciccarelli RB. 1997. Automated fed-batch fermenta-
consumption rate models. Instead, it relies on more frequent
tion with feed-back controls based on dissolved oxygen (DO) and
measurement of the indicator metabolite, for example,
pH for production of DNA vaccines. J Ind Microbiol Biotechnol 18:
glucose, and the subsequent feeding that is designed to bring
the indicator metabolite to a preset control level (Chee
Derfus GE, Abramzon D, Tung M, Chang D, Kiss R, Amanullah A.
2009. Cell culture monitoring via an auto-sampler and an integrated
Furng Wong et al., 2005; Lee et al., 2003; Zhou et al., 1995,
multi-functional off-line analyzer. Biotechnol Prog 26(1):284–
1997). This strategy has been successfully used to control low
levels of glucose and glutamine, but for this work glucose
Dowd JE, Kwok KE, Piret JM. 2001a. Glucose-based optimization of CHO-
was maintained at around 4–5 g/L in order to keep the
cell perfusion cultures. Biotechnol Bioeng 75:252–256.
culture from either over-feeding or under-feeding. Glucose
Dowd JE, Kwok KE, Piret JM. 2001b. Predictive modeling and loose-loop
control for perfusion bioreactors. Biochem Eng J 9:1–9.
as a feed indicator is simple, requires the least prior
Gong X, Li D, Li X, Fang Q, Han X, Wu Y, Yang S, Shen BQ. 2006. Fed-
knowledge and is adaptable to both changes in cell density
batch culture optimization of a growth-associated hybridoma cell
and metabolism.
line in chemically defined protein-free media. Cytotechnology 52(1):
It is also important to note that the overall improvements
on productivity, for example, from 4 g/L of the baseline
Huang YM, Hu W, Rustandi E, Chang K, Yusuf-Makagiansar H, Ryll T.
2010. Maximizing productivity of CHO cell-based fed-batch culture
platform process to 9.1 g/L for the dynamic feeding process,
using chemically defined media conditions and typical manufacturing
is only possible with the optimized feed medium. The
equipment. Biotechnol Prog 26(5):1400–1410.
automatic dynamic feeding method, however, made it
Junker BH, Wang HY. 2006. Bioprocess monitoring and computer control:
possible to evaluate the various feed medium formulations
key roots of the current PAT initiative. Biotechnol Bioeng 95(2):226–
without the need to establish a priori how these different
Kelley B. 2009. Industrialization of mAb production technology: The
feed media should be administered in terms of dose and
bioprocessing industry at a crossroads. MAbs 1(5):443–452.
frequency. Therefore, the combined approach of dynamic
Kim BS, Lee SC, Lee SY, Chang YK, Chang HN. 2004. High cell density fed-
feeding and iterated feed medium optimization has the clear
batch cultivation of Escherichia coli using exponential feeding com-
synergistic benefit. Automation is also a main feature in our
bined with pH-stat. Bioprocess Biosyst Eng 26:147–150.
studies, as many earlier efforts on dynamic feeding had to
Kiviharju K, Salonen K, Moilanen U, Eerikainen T. 2008. Biomass mea-
surement online: The performance of in situ measurements and
rely on manual adjustments based on off-line measurements
software sensors. J Ind Microbiol Biotechnol 35(7):657–665.
(Xie and Wang, 1994a,b, 1996; Xie et al., 1997; Yu et al.,
Krairak S, Yamamura K, Irie R, Nakajima M, Shimizu H, Chim-Anage P,
2011; Zhou et al., 1995, 1997a,b). Advances in automation
Yongsmith B, Shioya S. 2000. Maximizing yellow pigment production
have enabled more advanced feedback control mechanisms
in fed-batch culture of Monascus sp. J Biosci Bioeng 90(4):363–367.
without a concomitant increases in labor. A fully integrated
Kurokawa H, Park YS, Iijima S, Kobayashi T. 1994. Growth characteristics
in fed-batch culture of hybridoma cells with control of glucose and
sampling, data acquisition, and control system has the
glutamine concentrations. Biotechnol Bioeng 44:95–103.
capability of responding to a wide variety of inputs.
Kuwae S, Ohda T, Tamashima H, Miki H, Kobayashi K. 2005. Development
Alternative methods could also be developed for subgroups
of a fed-batch culture process for enhanced production of recombinant
of metabolites that could be broken up into separate feeds
human antithrombin by Chinese hamster ovary cells. J Biosci Bioeng
that vary in predetermined ratios to one another. An
Lee YY, Yap MG, Hu WS, Wong KT. 2003. Low-glutamine fed-batch
expansion in the number of available inputs could further
cultures of 293-HEK serum-free suspension cells for adenovirus pro-
improve feeding algorithms to develop a control system that
duction. Biotechnol Prog 19(2):501–509.
is dependent on inherent cell metabolism. An evolution of
Li J, Wong CL, Vijayasankaran N, Hudson T, Amanullah A. 2012. Feeding
this feeding algorithm could define a platform process that
lactate for CHO cell culture processes: Impact on culture metabolism
adapts to natural variations in cell lines in order to ensure
and performance. Biotechnol Bioeng 109:1173–1186.
Opel CF, Li J, Amanullah A. 2010. Quantitative modeling of viable cell
optimal productivity and quality is reached in the shortest
density, cell size, intracellular conductivity, and membrane capacitance
time possible, translating technological advancements into
in batch and fed-batch CHO processes using dielectric spectroscopy.
high throughput process development.
Biotechnol Prog 26(4):1187–1199.
Biotechnology and Bioengineering, Vol. 110, No. 1, January, 2013
Po¨rtner R, Schwabe JO, Frahm B. 2004. Evaluation of selected control
Xie L, Nyberg G, Gu X, Li H, Mo¨llborn F, Wang DIC. 1997. Gamma-
strategies for fed-batch cultures of a hybridoma cell line. Biotechnol
interferon production and quality in stoichiometric fed-batch cultures
Appl Biochem 40:47–55.
of Chinese hamster ovary (CHO) cells under serum-free conditions.
Sauer PW, Burky JE, Wesson MC, Sternard HD, Qu L. 2000. A high-
Biotechnol Bioeng 56:577–582.
yielding, generic fed-batch cell culture process for production of
Yu M, Hu Z, Pacis E, Vijayasankaran N, Shen A, Li F. 2011. Understanding
recombinant antibodies. Biotechnol Bioeng 67(5):585–597.
the intracellular effect of enhanced nutrient feeding toward high
Teixeira AP, Oliveira R, Alves PM, Carrondo MJ. 2009. Advances in on-line
titer antibody production process. Biotechnol Bioeng 108(5):1078–
monitoring and control of mammalian cell cultures: Supporting the
PAT initiative. Biotechnol Adv 27(6):726–732.
Zhang L, Shen H, Zhang Y. 2004. Fed-batch culture of hybridoma cells in
Wlaschin KF, Hu WS. 2006. Fedbatch culture and dynamic nutrient
serum-free medium using an optimized feeding strategy. J Chemi Tech
feeding. Adv Biochem Eng Biotechnol 101:43–74.
Xie L, Wang DI. 1994a. Fed-batch cultivation of animal cells using different
Zhou W, Hu W-S. 1994. On-line characterization of a hybridoma cell
medium design concepts and feeding strategies. Biotechnol Bioeng
culture process. Biotechnol Bioeng 44:170–177.
Zhou W, Rehm J, Hu WS. 1995. High viable cell concentration fed-batch
Xie L, Wang DI. 1994b. Applications of improved stoichiometric model in
cultures of hybridoma cells through on-line nutrient feeding. Biotech-
medium design and fed-batch cultivation of animal cells in bioreactor.
nol Bioeng 46(6):579–587.
Zhou W, Chen CC, Buckland B, Aunins J. 1997. Fed-batch culture of
Xie L, Wang DI. 1996. High cell density and high monoclonal antibody
recombinant NS0 myeloma cells with high monoclonal antibody
production through medium design and rational control in a bioreac-
production. Biotechnol Bioeng 55(5):783–792.
tor. Biotechnol Bioeng 51:725–729.
Lu et al.: Automated Dynamic Fed-Batch Process and Media Optimization
Biotechnology and Bioengineering
Source: http://www.novabio.us/press/NovaBio_FLEX_CellCulture.pdf
Marilyn Herie, Ph.D., TSI Tim Godden, M.S.S., TSI Joanne Shenfeld, M.S.S. Colleen Kelly, M.S.S., TSI Guide d'information Guide à l'intention des personnes aux prises avec une toxicomanie et de leur famille Marilyn Herie, Ph.D, TSI Tim Godden, M.S.S., TSI Joanne Shenfeld, M.S.S. Colleen Kelly, M.S.S., TSI Un Centre collaborateur de l'Organisation panaméricaine de la santé et de
2015 ADEA ABSTRACT SUBMISSION PREPARATION Oral presentations and E-Poster presentations Selecting Your Program Streams The Program Organising Committee (POC) accepts submissions of abstracts of original contributions on any topic related to the following program streams: 1. Scientific 2. Program Evaluation/Review of Resource Delivery/Quality Improvement Activity 3. Clinical Practice/Case Studies/Service Delivery