名称未設定
PTH/PTHrP Receptor Mediates Cachexia in Modelsof Kidney Failure and Cancer
Graphical Abstract
Serkan Kir, Hirotaka Komaba,Ana P. Garcia, ., Beate Lanske,Richard A. Hodin, Bruce M. Spiegelman
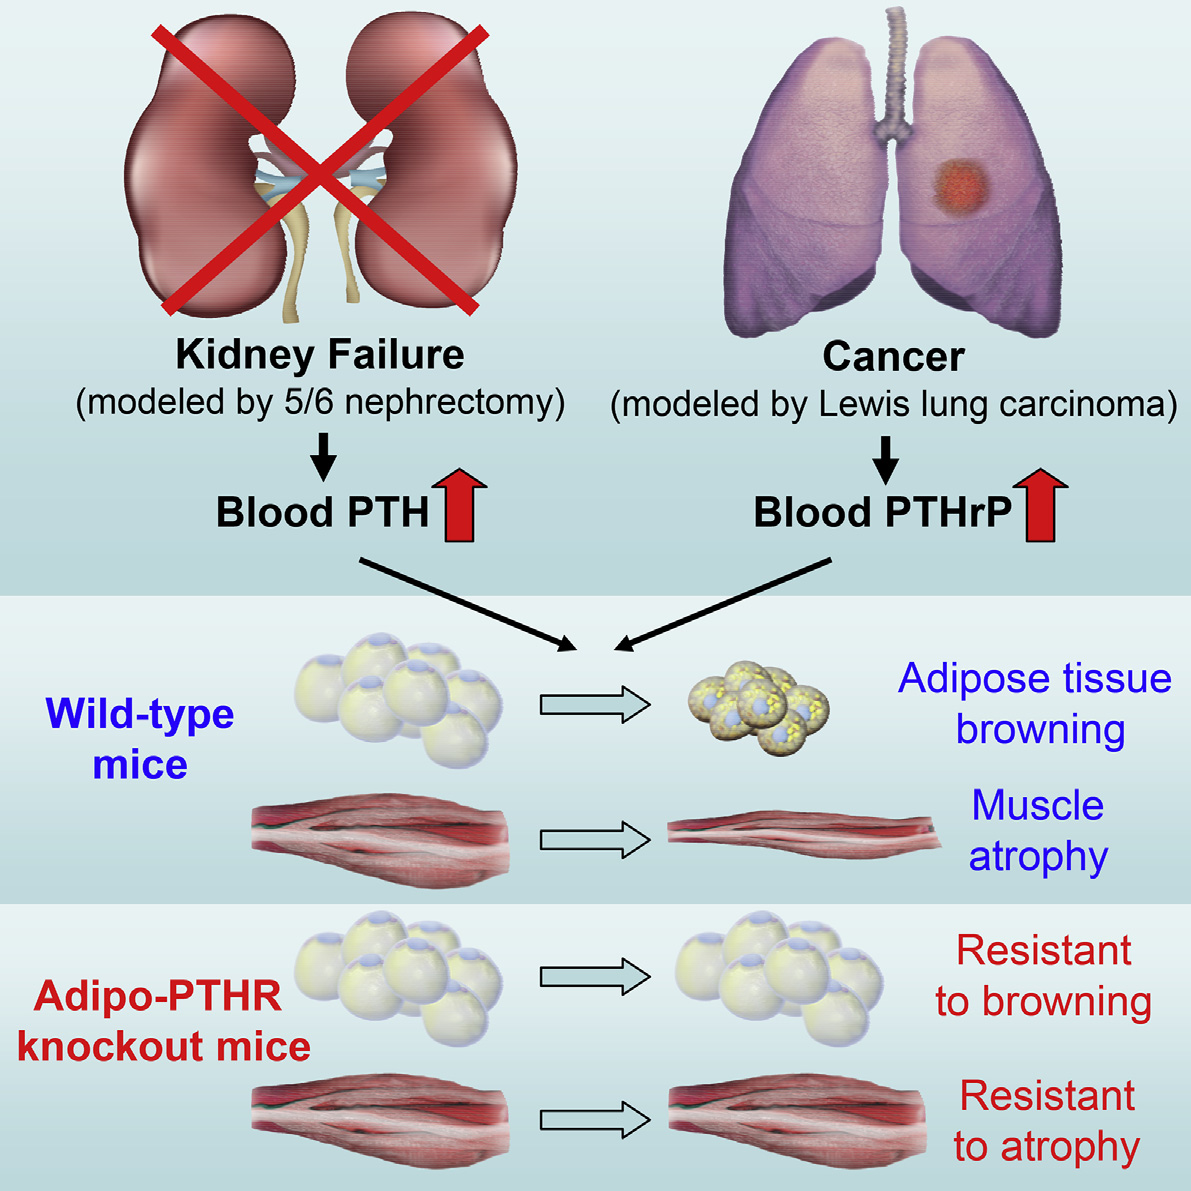
In BriefKir et al. reveal a role for the PTH/PTHrPpathway in cachexia driven by kidneyfailure or cancer and show how PTH andPTHrP stimulate adipose tissue browningthrough their receptor PTHR. Loss ofPTHR in adipocytes blocks atrophy of notonly fat tissue, but also skeletal muscle inmice.
Accession Numbers
5/6 nephrectomy and LLC tumors trigger cachexia and
adipose tissue browning
Elevated circulating PTH and PTHrP stimulate browningthrough their receptor PTHR
PTHR function in fat is required for adipose tissue browningand wasting
Loss of PTHR in fat tissue also attenuates skeletal muscleatrophy
Kir et al., 2016, Cell Metabolism 23, 1–9February 9, 2016 ª2016 Elsevier Inc.
Please cite this article in press as: Kir et al., PTH/PTHrP Receptor Mediates Cachexia in Models of Kidney Failure and Cancer, Cell Metabolism (2016),http://dx.doi.org/10.1016/j.cmet.2015.11.003
Cell MetabolismArticle
PTH/PTHrP Receptor Mediates Cachexiain Models of Kidney Failure and Cancer
Serkan Kir,1 Hirotaka Komaba,2 Ana P. Garcia,1 Konstantinos P. Economopoulos,3 Wei Liu,3 Beate Lanske,2Richard A. Hodin,3 and Bruce M. Spiegelman1,*1Department of Cancer Biology, Dana-Farber Cancer Institute, Harvard Medical School, Boston, MA 02215, USA2Department of Oral Medicine, Infection, and Immunity, Harvard School of Dental Medicine, Boston, MA 02115, USA3Department of Surgery, Massachusetts General Hospital, Harvard Medical School, Boston, MA 02114, USA*Correspondence:
in rodents, whereas pockets of such cells can also be found inwhite adipose tissues upon cold exposure or with certain hor-
Cachexia is a wasting syndrome associated with
mones. These latter cells come from a distinct cell lineage
elevated basal energy expenditure and loss of adi-
from classical brown fat and are termed beige adipocytes (Wu
pose and muscle tissues. It accompanies many
et al., 2012). The thermogenic activity of brown/beige fat con-
chronic diseases including renal failure and cancer
tributes significantly to energy expenditure in rodents. Both
and is an important risk factor for mortality. Our
brown and beige fat cells are also found in humans and play a
recent work demonstrated that tumor-derived PTHrP
role in energy homeostasis (Cypess et al., 2013; Virtanenet al., 2009). Several studies have described activation of brown
drives adipose tissue browning and cachexia. Here,
fat in rodent models of cancer cachexia; anecdotal reports also
we show that PTH is involved in stimulating a thermo-
show activated brown fat in at least some cachectic patients
genic gene program in 5/6 nephrectomized mice that
(Bianchi et al., 1989; Bing et al., 2000; Brooks et al., 1981; Roe
suffer from cachexia. Fat-specific knockout of PTHR
et al., 1996; Shellock et al., 1986; Tsoli et al., 2012). ‘‘Browning''
blocked adipose browning and wasting. Surpris-
of the white fat depots drives wasting in rodent models of cancer
ingly, loss of PTHR in fat tissue also preserved mus-
cachexia (Kir et al., 2014; Petruzzelli et al., 2014; Tsoli et al.,
cle mass and improved muscle strength. Similarly,
PTHR knockout mice were resistant to cachexia
Our recent study identified parathyroid hormone-related pro-
driven by tumors. Our results demonstrate that
tein (PTHrP), a tumor-derived small polypeptide, as an inducer
PTHrP and PTH mediate wasting through a common
of thermogenic gene expression and wasting in adipose tissue
mechanism involving PTHR, and there exists an un-
(Kir et al., 2014). Interestingly, neutralization of PTHrP by a spe-cific antibody attenuated wasting of both fat tissue and skeletal
expected crosstalk mechanism between wasting of
muscle in tumor-bearing mice (Kir et al., 2014). PTHrP is overex-
fat tissue and skeletal muscle. Targeting the PTH/
pressed by many tumors and its presence in the circulation cor-
PTHrP pathway may have therapeutic uses in
relates with a greater degree of wasting in patients with metasta-
humans with cachexia.
tic cancer (Kir et al., 2014). PTHrP and parathyroid hormone(PTH) share the same cell surface receptor, PTH/PTHrP receptoror PTHR (Vilardaga et al., 2011). Although PTH-secreting tumors
are very rare, secondary hyperparathyroidism is frequentlyobserved among patients with CKD (Bayne and Illidge, 2001;
Cachexia is a wasting syndrome associated with several ill-
Levin et al., 2007; Tentori et al., 2015). Here, using fat-specific
nesses including cancer, chronic kidney disease (CKD), and
PTHR-deficient mice, we investigated the role of the adipose
heart failure. Elevated basal energy expenditure in these disor-
PTH/PTHrP pathway in cachexia associated with both CKD
ders leads to wasting of adipose tissue and skeletal muscle
and cancer. Our results demonstrate that mice lacking PTHR
through enhanced fat and protein catabolism. Approximately
in their fat tissue are resistant to cachexia driven by renal failure
half of all patients with cancer suffer from cachexia (Argile´s
et al., 2014). Up to 75% of patients with CKD who are undergoingdialysis show signs of wasting (Mak et al., 2011). Cachexia leads
to poor outcomes and is an important risk factor for mortality.
Cachexia is very different from malnutrition because it cannot
5/6 Nephrectomy Causes Adipose Tissue Browning
be overcome by nutritional supplementation. There are currently
few, if any, effective therapies against cachexia (Fearon et al.,
5/6 Nephrectomy is a common experimental model for kidney
2013; Penna et al., 2010).
failure; this involves removal of one kidney and two-thirds of
There are now known to be at least two types of uncoupling
the other (Deboer, 2009). Nephrectomized mice suffer cachexia
protein 1 (UCP1)-expressing adipocytes (Peirce et al., 2014).
and have elevated circulating PTH. We used this model to inves-
Classical brown fat is located mainly in the interscapular region
tigate the roles of PTH in CKD-associated
Cell Metabolism 23, 1–9, February 9, 2016 ª2016 Elsevier Inc. 1
Please cite this article in press as: Kir et al., PTH/PTHrP Receptor Mediates Cachexia in Models of Kidney Failure and Cancer, Cell Metabolism (2016),http://dx.doi.org/10.1016/j.cmet.2015.11.003
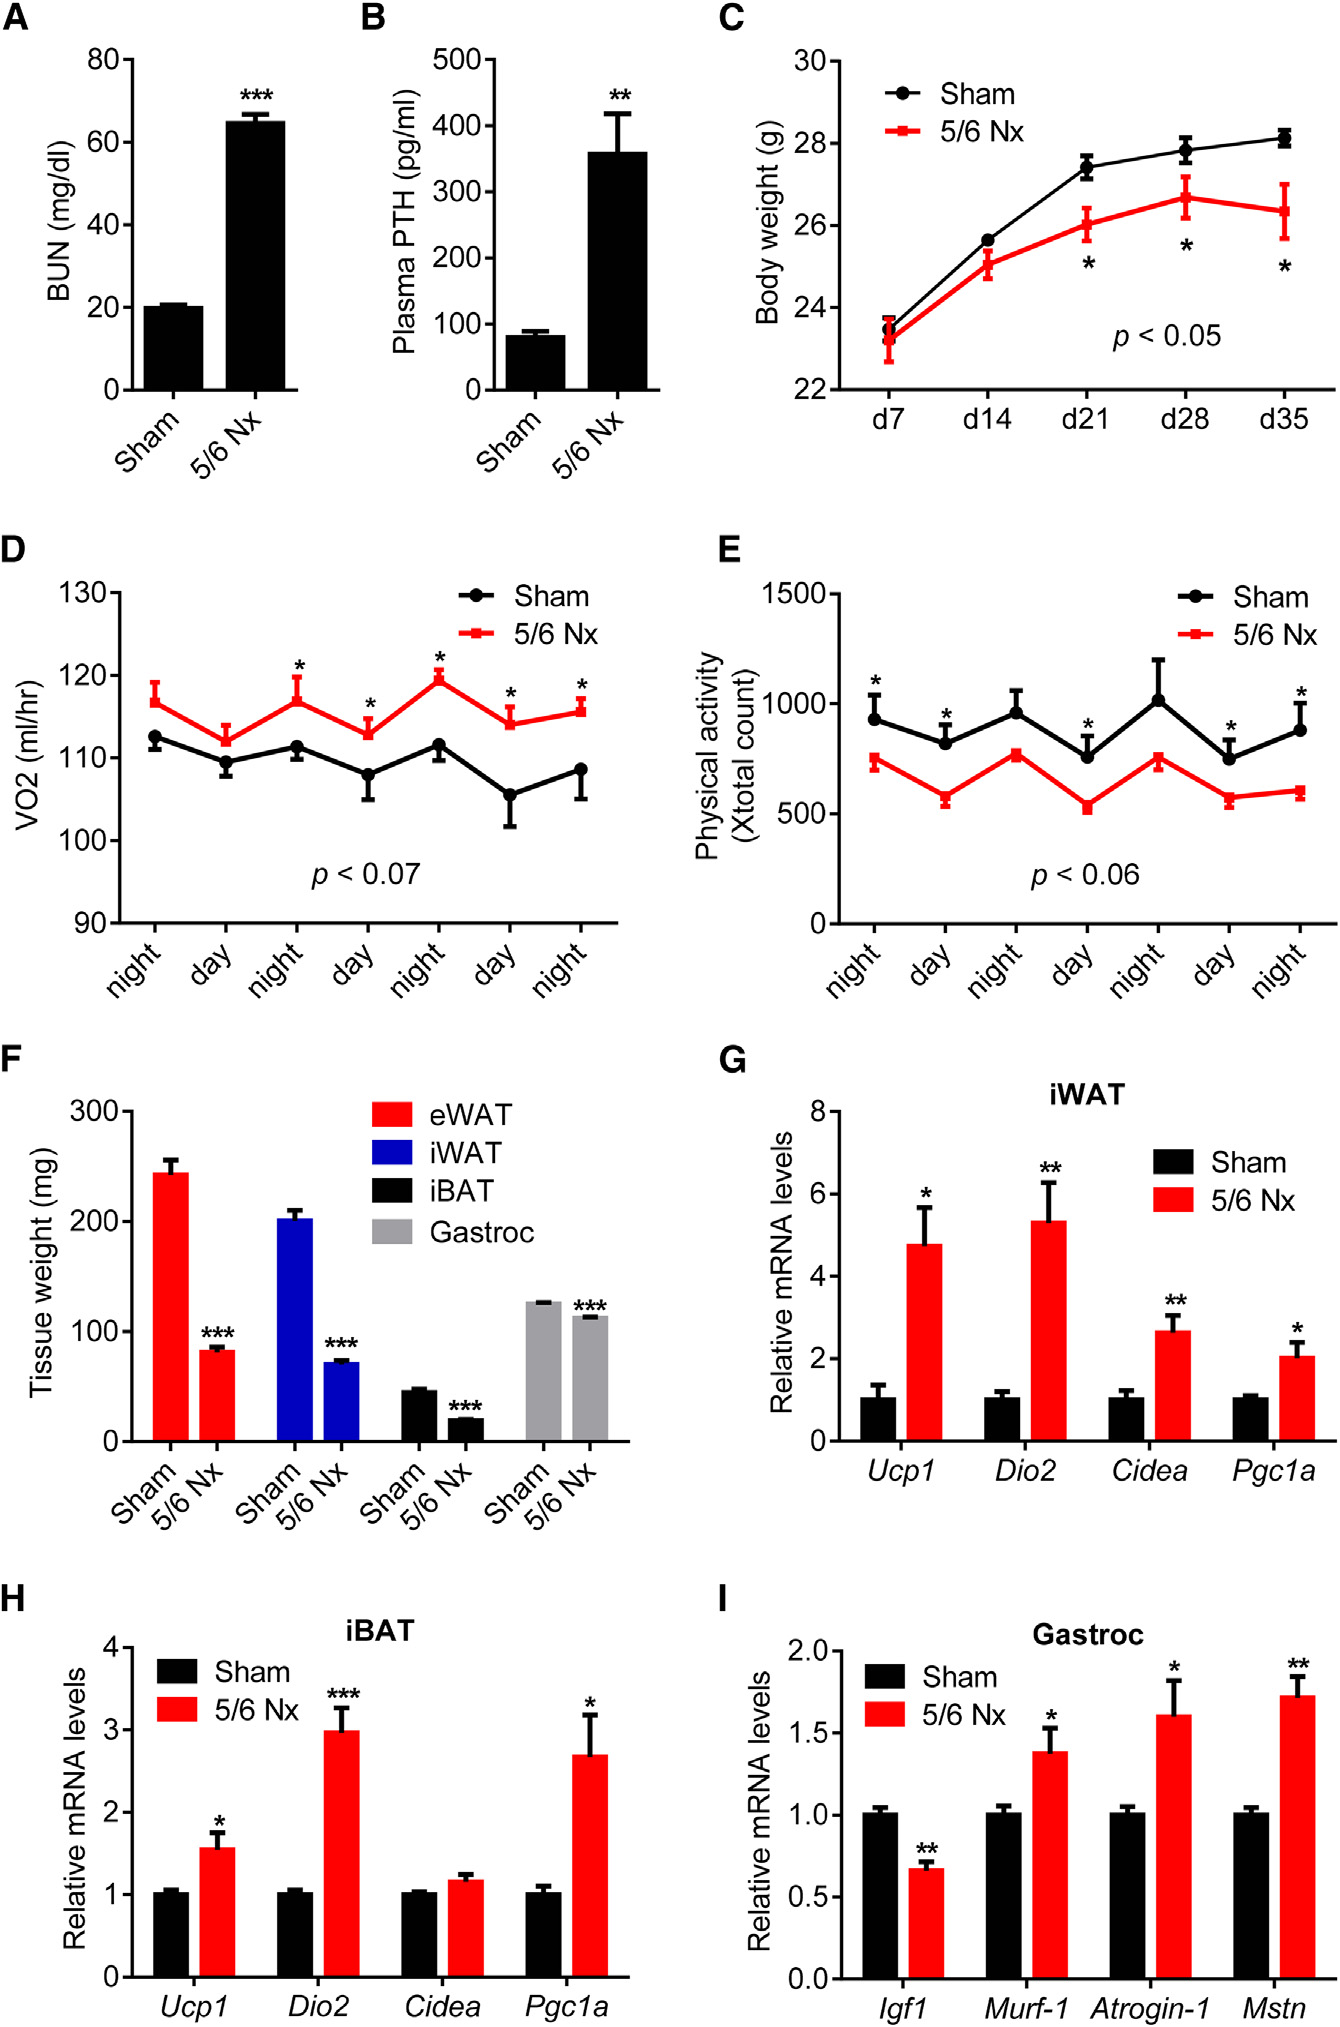
Figure 1. 5/6 Nephrectomized Mice DevelopCachexia with Adipose Tissue Browningand Skeletal Muscle Atrophy(A–I) Mice underwent sham or 5/6 nephrectomy (5/6 Nx) surgery and were killed 5 weeks later (n = 5–7). Blood urea nitrogen (BUN) (A), plasma PTHlevels (B), and body weight (C) were measured.
Mice were placed into metabolic cages betweenpost-surgery weeks 2 and 3, when the difference inbody weight was small. Oxygen consumption(VO2) (D) and physical activity (E) were monitored.
Fat and muscle tissues were dissected andweighed (F). mRNA levels in iWAT (G), iBAT (H),and gastrocnemius muscle (I) were determinedwith RT-qPCR. The values are mean ± SEM. *p <0.05, **p < 0.005, ***p < 0.0005. See also FiguresS1 and S2.
white fat (iWAT; a form of subcutaneousfat), interscapular brown fat (iBAT), andgastrocnemius muscle all exhibited sig-nificant decreases in total mass (Figures1F, S2A, and S2B). We performed geneexpression analysis to understand themechanisms involved. Expression of thethermogenic genes Ucp1, Dio2, Cidea,and Pgc1a were induced in iWAT, iBAT,and to a lesser extent in eWAT (Figures1G, 1H, and S2C). Skeletal musclewasting of the nephrectomized micewas also accompanied by a decrease inexpression of the pro-growth hormoneIgf1 and induction of the muscle atro-phy-related genes Murf-1, Atrogin-1,and Myostatin (Figure 1I).
PTH Stimulates Expression ofThermogenic Genes in Fat TissuesPTHrP is a potent inducer of thermogenicgene expression (Kir et al., 2014). PTHrPand PTH are similar in that they sharesequence homology in their first 34 resi-dues and, in all cases studied to date,act on the same cell surface receptor.
The elevation of PTH in the nephrectom-ized mice led us to ask whether PTH
Nephrectomized mice developed uremia as assessed by blood
administration could drive a thermogenic program in adipose
urea nitrogen (BUN) levels and displayed elevated circulating
cultures and in vivo. Like PTHrP(1–34), PTH(1–34) and full-length
PTH (Figures 1A, 1B, and S1A). These mice showed reduced
PTH(1–84) stimulated mRNA levels of Ucp1, Dio2, and Pgc1a
body weight compared to sham-operated controls (Figure 1C).
when added to primary inguinal fat cells (Figure 2A). Both PTH
The weight loss phenotype was accompanied by increased en-
and PTHrP peptides also stimulated UCP1 protein levels and
ergy expenditure, as shown by elevated O2 consumption and
cellular respiration, including uncoupled respiration, through a
elevated heat production (Figures 1D and S1B). CO2 production
mechanism involving the PKA signaling cascade (Kir et al.,
was also elevated with no changes in respiratory quotient (Fig-
2014). Furthermore, PTH administration to mice led to induction
ures S1C and S1D). Importantly, the weight loss was not due
of these genes in various fat tissues (Figures 2B–2D). Therefore,
to increased physical activity or reduced food intake (Figures
elevations in circulating PTH may induce thermogenesis in fat.
1E and S1E). We further documented the cachexia phenotype
To test the connection between thermogenic gene expression
by measuring weight of fat and skeletal muscle tissues. Epidid-
in adipose tissues and PTH levels in humans, we examined pa-
ymal white adipose tissue (eWAT; a visceral fat depot), inguinal
tients with primary hyperparathyroidism (PHPT). Subcutaneous
2 Cell Metabolism 23, 1–9, February 9, 2016 ª2016 Elsevier Inc.
Please cite this article in press as: Kir et al., PTH/PTHrP Receptor Mediates Cachexia in Models of Kidney Failure and Cancer, Cell Metabolism (2016),http://dx.doi.org/10.1016/j.cmet.2015.11.003
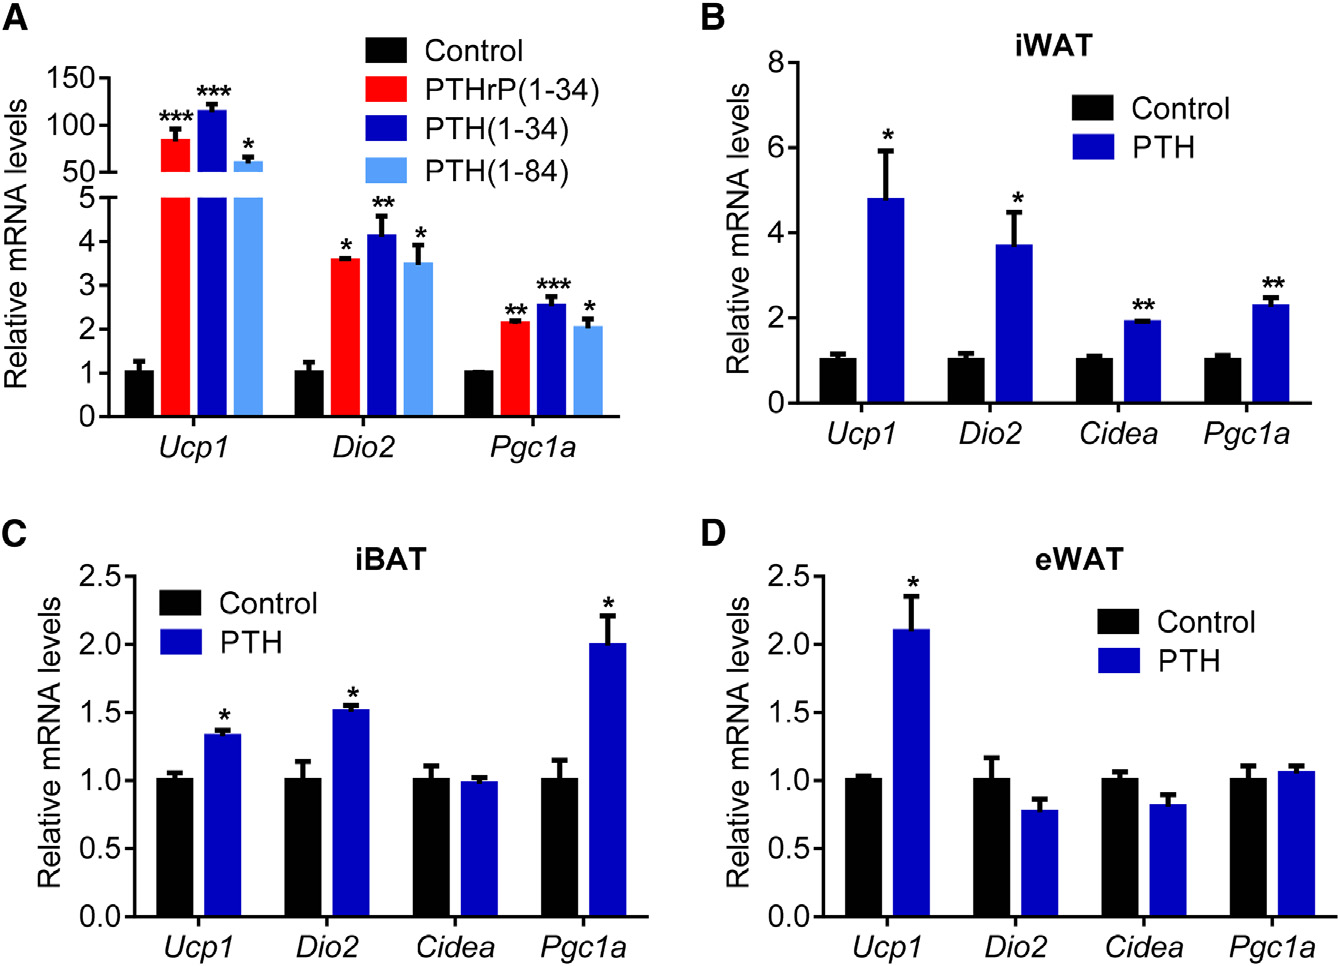
Figure 2. PTH Treatment Elevates the Ther-mogenic Gene Program(A) Primary cultures of inguinal adipocytes weretreated with 10 ng/ml PTHrP(1–34), 10 ng/mlPTH(1–34), or 25 ng/ml PTH(1–84) for 2 hr (n = 3).
(B–D) Mice received a single dose of PTH(1–34)(1 mg/kg body weight; subcutaneously) and werekilled 2 hr later (n = 6). Gene expression changeswere determined with RT-qPCR.
The values are mean ± SEM. *p < 0.05, **p < 0.005,***p < 0.0005.
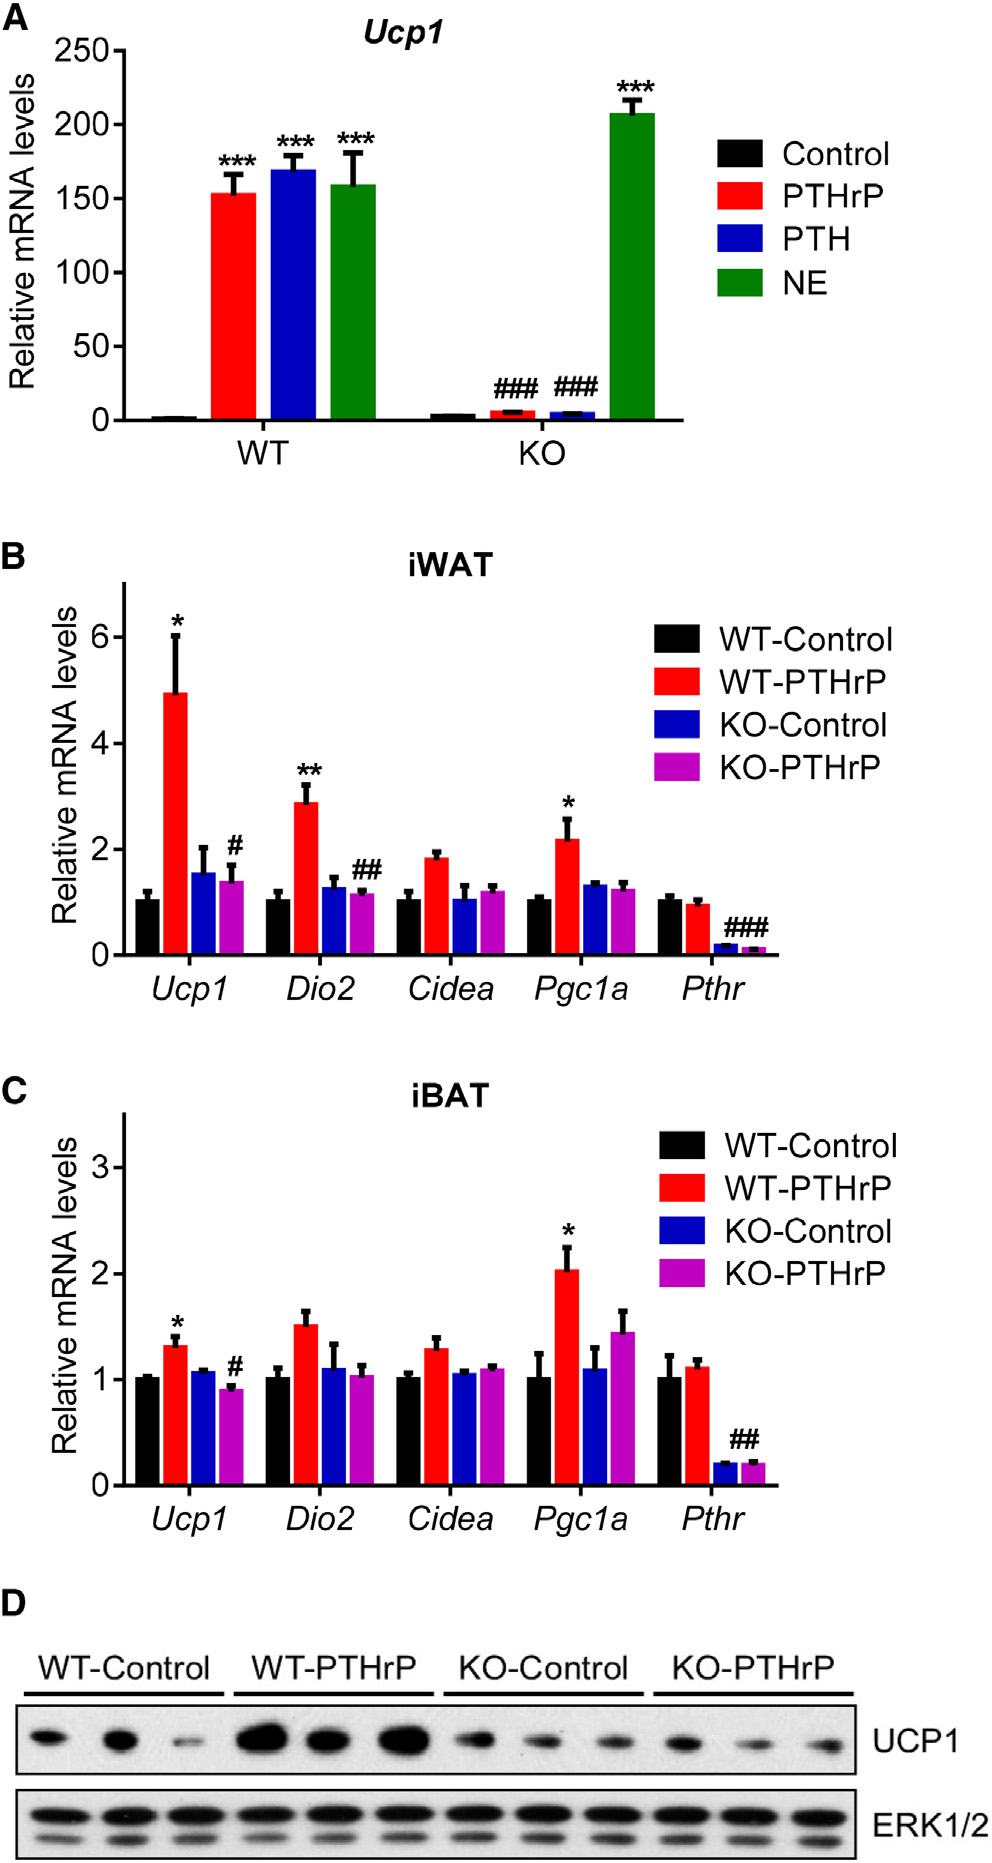
expression of the thermogenic genes inwhite and brown fat depots (Figures 4B–4D). These findings indicate that PTHand PTHrP depend entirely on the well-defined receptor PTHR to drive the ther-mogenic gene program. Of note, we alsotried to generate skeletal muscle-specificPTHR knockout mice using human skel-etal alpha (HSA)-Cre driver. To our sur-prise, we were unable deplete PTHR in
and deep cervical fat samples were collected from patients un-
skeletal muscle tissue despite obtaining very robust Cre expres-
dergoing parathyroidectomy for PHPT. The control group sam-
sion. This is in agreement with a previous report demonstrating
ples were collected from patients undergoing thyroidectomy
PTHR localization in Pax7+ satellite cells and CD34+ hematopoi-
for benign pathologies (i.e., Graves disease, benign goiter, and
etic stem cells but not in the mature myotubes (Kimura and Yosh-
Hurtle-cell neoplasm). Importantly, none of the patients had hy-
ioka, 2014).
perthyroidism, which is known to be involved in thermogenicregulation (Table S1). We first compared subcutaneous and
Adipo-PTHR-KO Mice Are Resistant to 5/6
deep cervical fat samples from all patients and tested mRNA
levels of some marker genes previously described by a study
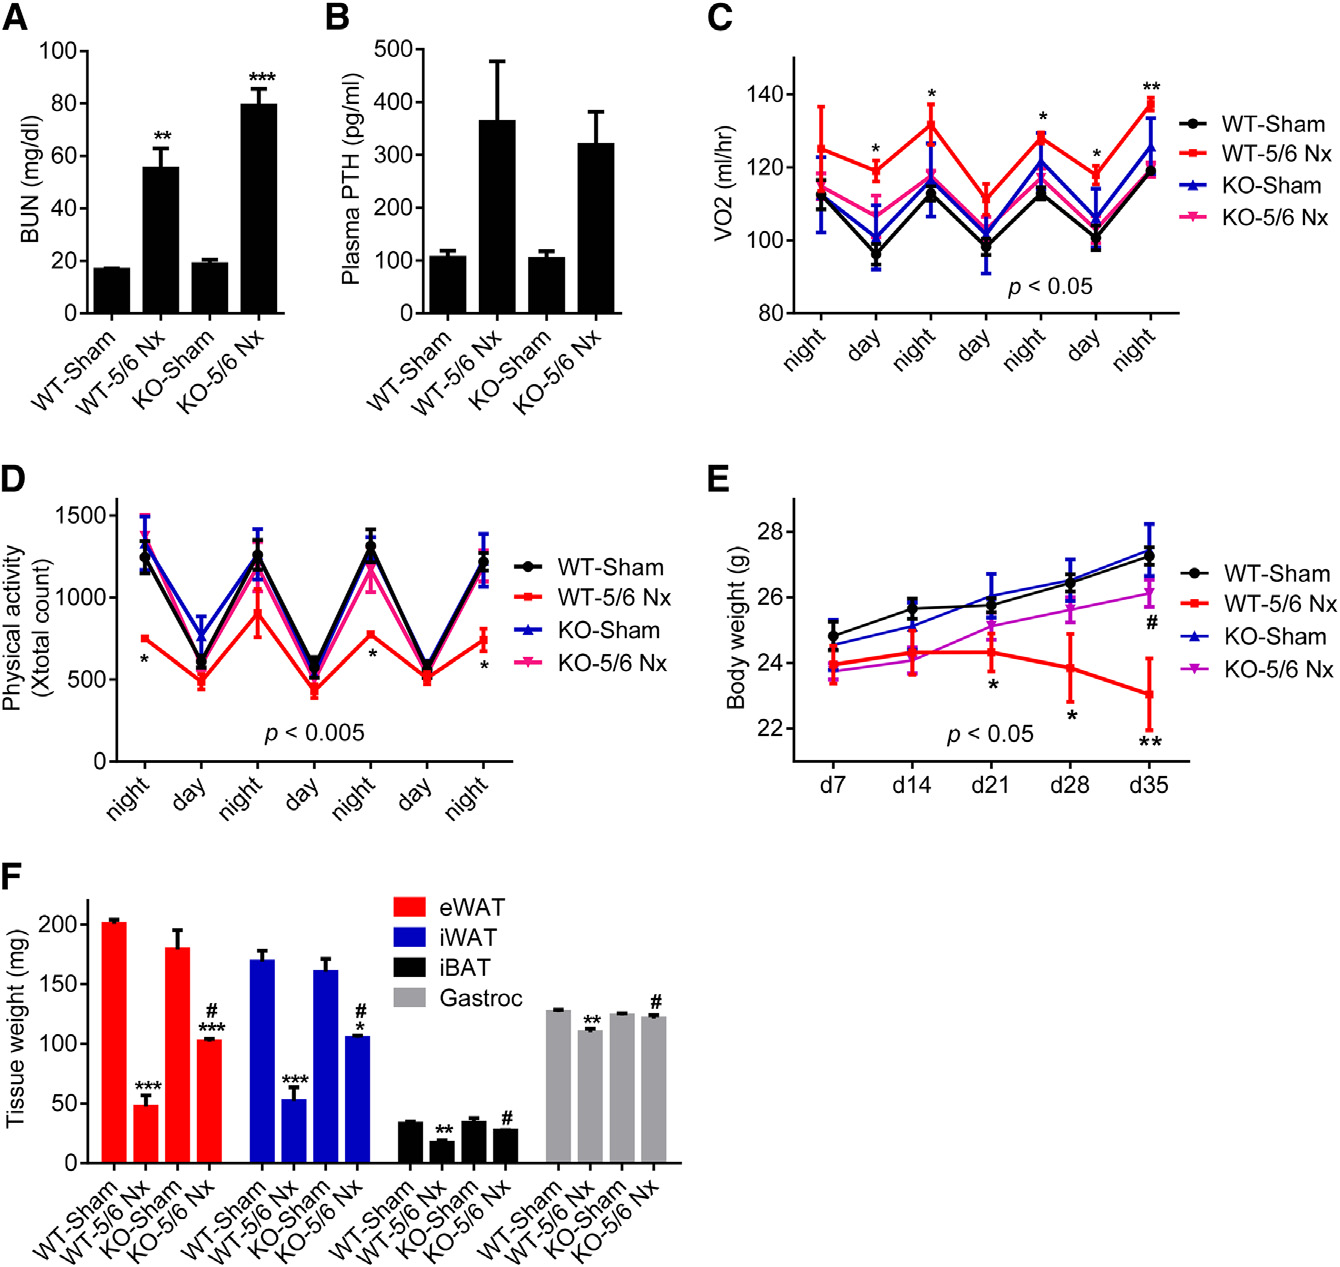
Next, we examined the contribution of elevated circulating PTH
examining gene expression profiles of these anatomical loca-
to cachexia associated with 5/6 nephrectomy. We examined
tions (Cypess et al., 2013). We found that expression of UCP1
metabolic phenotypes of 5/6 nephrectomized Adipo-PTHR-
and LHX8 is elevated in deep cervical fat (Figure 3A) while
KO and their wild-type (WT) littermates. Both groups devel-
expression of LEPTIN and SHOX2 is enriched in subcutaneous
oped similar uremia and secondary hyperparathyroidism
samples (Figure 3B). We next compared mRNA levels of
upon 5/6 nephrectomy (Figures 5A, 5B, and S4A). As shown
thermogenic genes in the PHPT and control groups. Although
in Figures 1D and S1B, energy expenditure and heat produc-
expression of these genes in subcutaneous fat does not differ
tion of the WT mice significantly increased upon nephrectomy
between the two groups (Figure 3C), we observed significant up-
while their physical activity was significantly decreased (Fig-
regulation of CIDEA and PGC1A and an upward trend for UCP1
ures 5C, 5D, and S4B). Interestingly, nephrectomy-driven hy-
and DIO2 expression in PHPT deep cervical samples (Figure 3D).
permetabolism was greatly suppressed in Adipo-PTHR-KO
The deep cervical fat has characteristics of both brown and
mice while their physical activity was improved (Figures 5C,
beige fat with significant thermogenic capacity (Cypess et al.,
5D, and S4B). CO2 production, respiratory quotient, and food
2013). Therefore, it is likely that upregulation of thermogenesis
intake were unchanged among Adipo-PTHR-KO mice (Figures
in such fat depots by PTH may contribute significantly to
S4C–S4E). In agreement with the metabolic phenotypes, neph-
rectomized Adipo-PTHR-KO mice lost weight to a lesser extentcompared to the WT nephrectomy group, which exhibited
PTHrP and PTH Signal through PTHR to Induce Ucp1
severe cachexia (Figure 5E). Wasting of fat tissue and, surpris-
ingly, wasting of skeletal muscle were improved in the Adipo-
To investigate the role of PTHR in cachexia in the models of kidney
PTHR-KO group (Figure 5F).
failure and cancer, we crossed PTHR-floxed mice (Pth1rlox/lox)
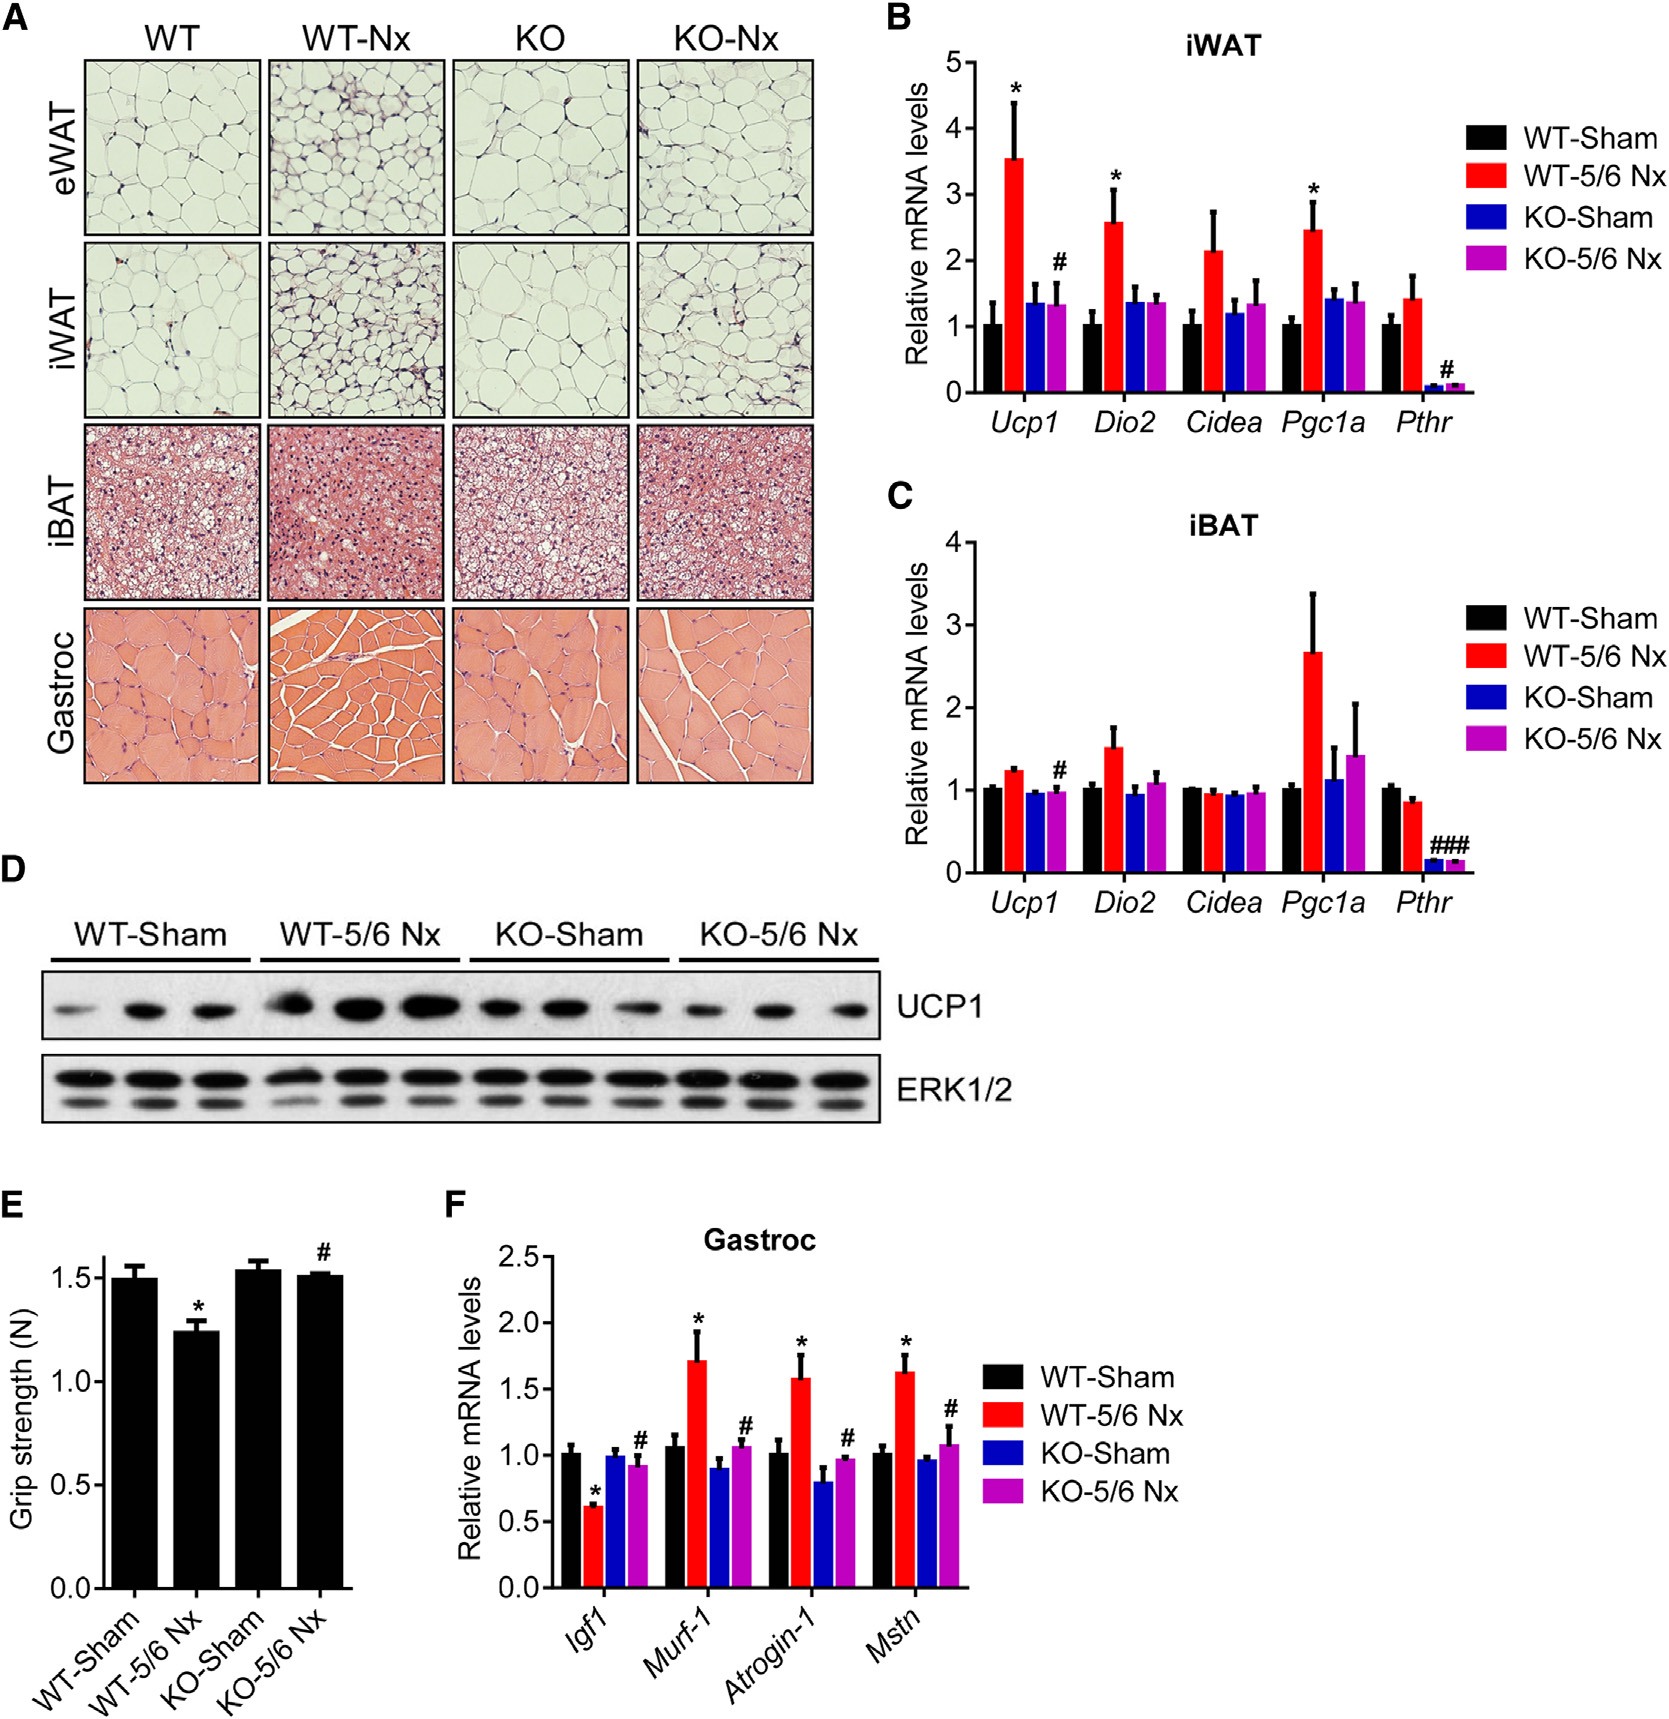
Histological examination of adipose tissues and skeletal mus-
(Kobayashi et al., 2002) with Adiponectin-Cre mice to generate
cle showed that deletion of PTHR in fat tissue prevented fat
fat cell-specific knockout animals (Adipo-PTHR-KO) (Figure S3).
droplet shrinkage and muscle fiber atrophy observed in the WT
We isolated primary fat cells from these mice and treated them
nephrectomy group (Figure 6A). PTHR depletion also blocked
with PTHrP, PTH, or norepinephrine. Whereas norepinephrine
upregulation of thermogenic genes in fat tissues (Figures 6B–
robustly induced Ucp1 mRNA expression in the knockout cells,
6D). In addition to preserving muscle mass, nephrectomized
PTHrP and PTH completely failed to upregulate Ucp1 (Figure 4A).
Adipo-PTHR-KO mice also maintained their muscle strength,
Similarly, PTHrP treatment of the knockout mice did not induce
as evidenced by improved grip strength compared to
Cell Metabolism 23, 1–9, February 9, 2016 ª2016 Elsevier Inc. 3
Please cite this article in press as: Kir et al., PTH/PTHrP Receptor Mediates Cachexia in Models of Kidney Failure and Cancer, Cell Metabolism (2016),http://dx.doi.org/10.1016/j.cmet.2015.11.003
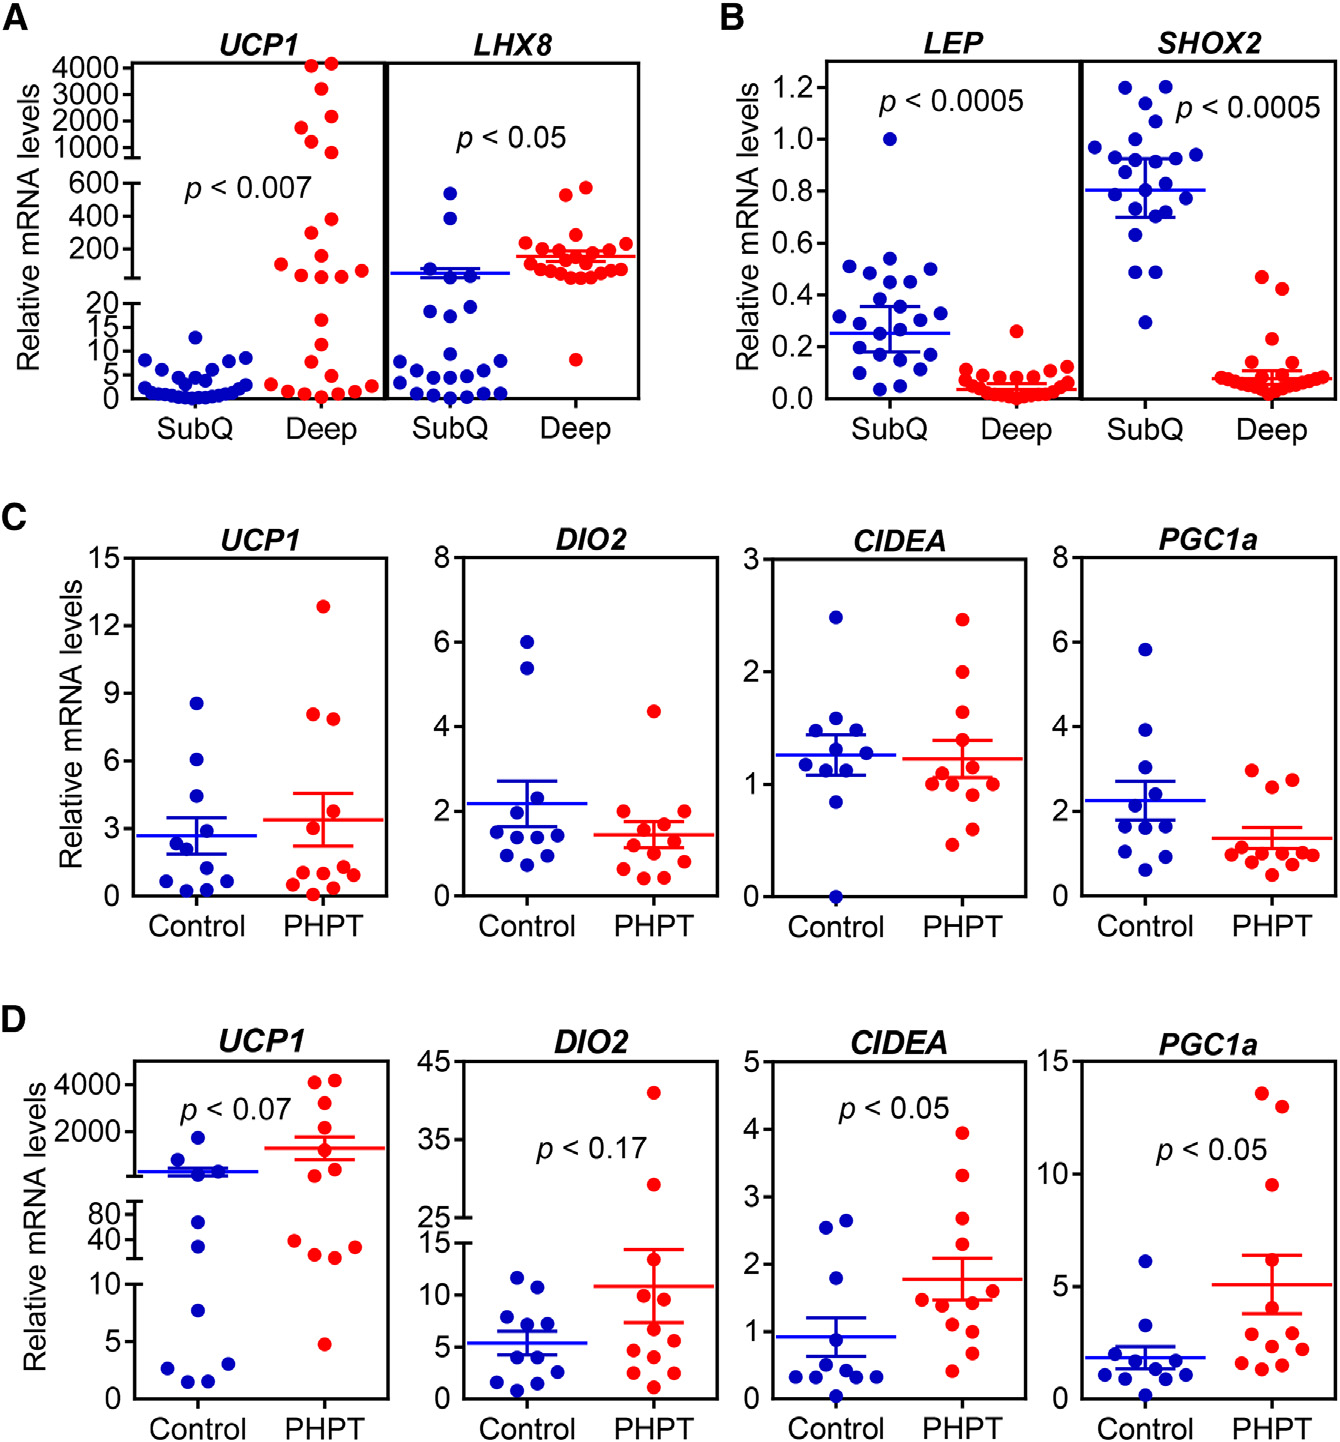
Figure 3. The Thermogenic Gene ProgramIs Increased in Primary Hyperparathyroid-ism(A–D) Subcutaneous and deep cervical fat sampleswere collected from patients undergoing necksurgeries. Gene expression levels were comparedbetween subcutaneous and deep cervical samples(n = 23) (A and B) or within subcutaneous fat (C) anddeep cervical fat (D) of control and primary hy-perparathyroidism patients (PHPT) (n = 11–12).
mRNA levels were determined with RT-qPCR.
Statistics by two-tailed t test.
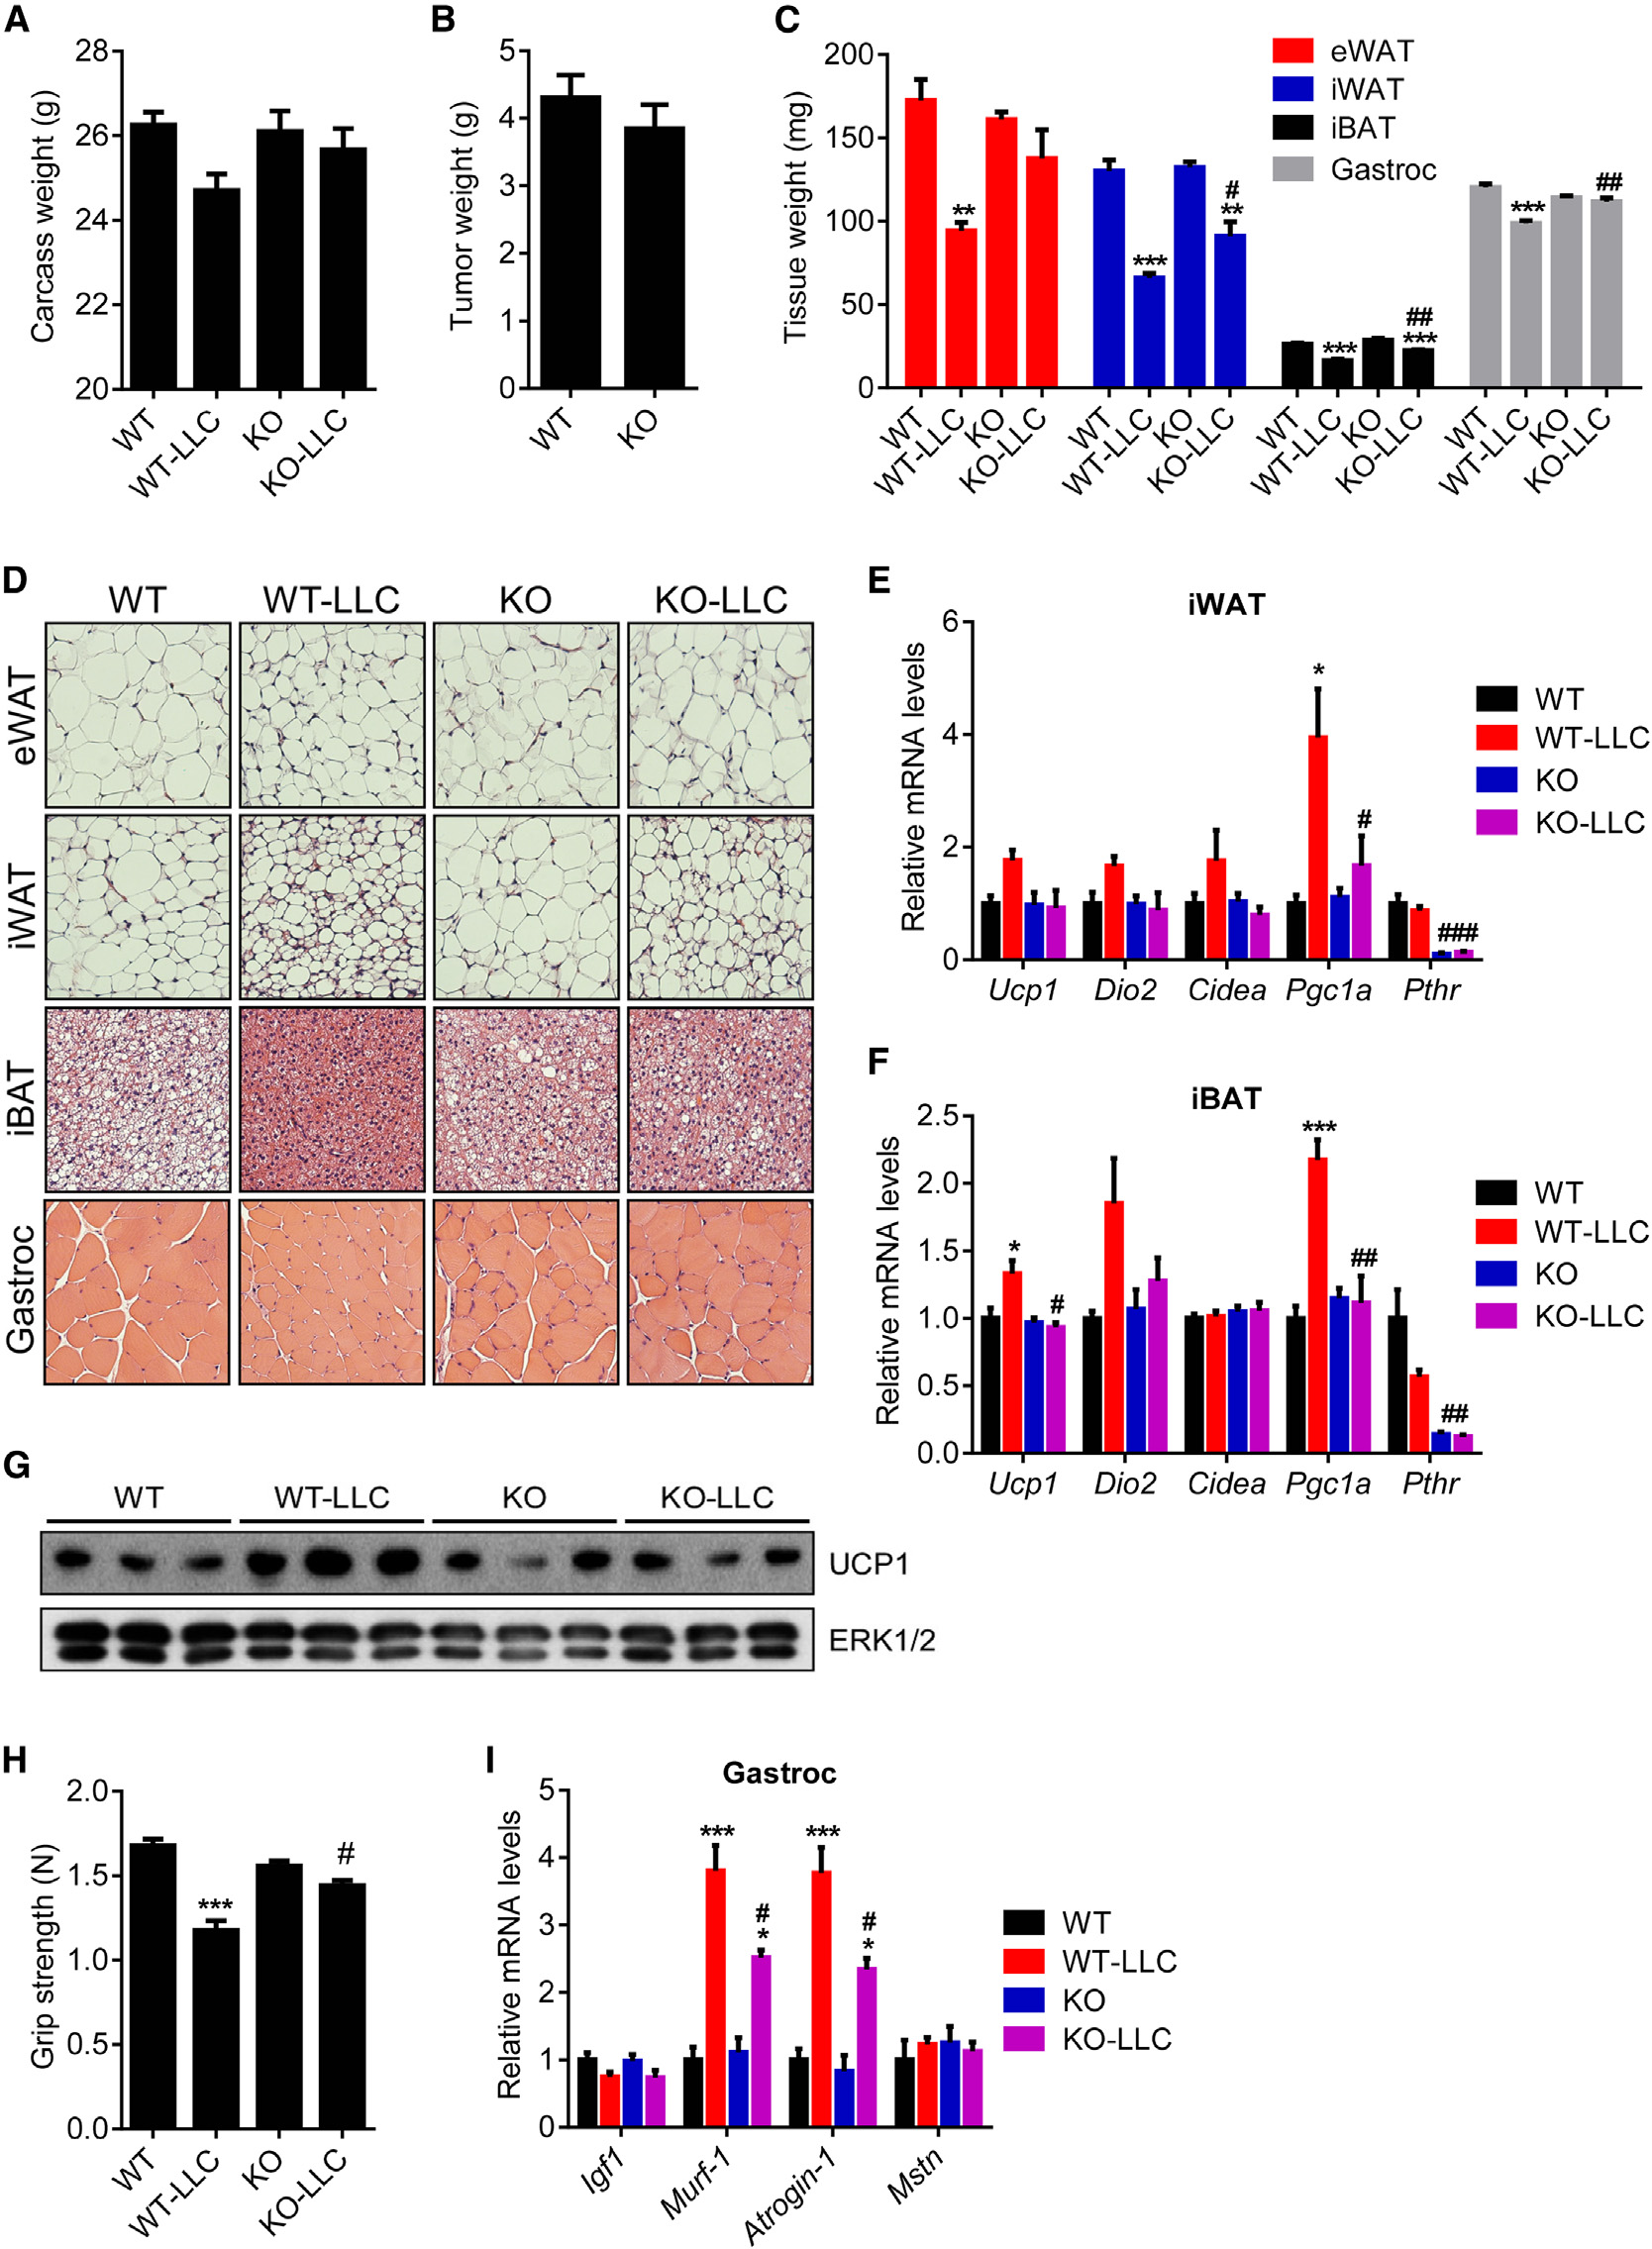
larger fat droplets and muscle fibers inthe
mice (Figure 7D). Similar results werealso
mice killed 14 days after tumor inocula-tion when WT controls were experi-encing moderate cachexia (Figure S6).
Gene expression analysis on thesemice indicated that Adipo-PTHR-KOgroup is resistant to browning inducedby LLC tumors (Figures 7E–7G). Musclefunction of the knockout mice was alsosignificantly improved as atrophy-relatedgene expression in their muscle tissuewas significantly suppressed (Figures7H and 7I). These observations aresimilar to our published results on PTHrPneutralization by a specific antibodygiven systemically (Kir et al., 2014), butthese new data indicate that cachectic
nephrectomized WT mice (Figure 6E). In accordance, induction
effects of tumor-derived PTHrP are essentially entirely medi-
of atrophy-related genes Murf-1, Atrogin-1, and Myostatin was
ated by PTHR expressed in fat tissues.
inhibited in the Adipo-PTHR-KO mice (Figure 6F). These findingssuggest existence of a PTH-PTHR signaling axis mediating
cachexia in kidney failure and an important crosstalk betweenfat and skeletal muscle wasting. One possible explanation for
Cachexia is a debilitating disease leading to poor outcomes in
this crosstalk is that PTH-induced, fat tissue-derived circulating
cancer and other chronic disorders. There is an urgent need for
factors may trigger muscle atrophy. Using microarrays, we
therapeutics against the wasting syndrome. PTHrP is produced
investigated global gene expression profiles of fat cells treated
by many tumors and it is often involved in the hypercalcemia of
with PTH or PTHrP. Expression of 13 genes that encode
malignancy (Iguchi et al., 2001; Mundy and Edwards, 2008).
secreted proteins were upregulated by both PTH and PTHrP
Our recent work demonstrated that tumor-derived PTHrP drives
(Figure S5). These include the circulating bioactive cytokines
adipose tissue browning and cachexia in tumor-bearing mice
Il6, Il33, Cxcl1, Cxcl5, and Cxcl14.
even when it is present at levels not sufficient to increase plasmacalcium. PTH and PTHrP share the same receptor specificity and
Adipo-PTHR-KO Mice Are Resistant to Lewis Lung
therefore may both be involved in cachexia. Circulating PTH has
been reported to be elevated in many chronic diseases, particu-
Results from the 5/6 nephrectomy study prompted us to
larly, in CKD (Childs et al., 2012; Dolecek et al., 2003; Jackson
examine tumor-driven cachexia in the Adipo-PTHR-KO mice
et al., 2013; Levin et al., 2007; Visser et al., 2003). Taken together,
using the Lewis Lung Carcinoma (LLC) model. Remarkably,
our new findings describe an important role for PTH in CKD-
16 days after tumor inoculation, mice with PTHR knockout in
related cachexia. Like PTHrP, PTH potently stimulates thermo-
adipose tissues did not suffer significant weight loss whereas
genic gene expression in fat tissue. Importantly and surprisingly,
WT mice displayed evident cachexia (Figure 7A). PTHR deple-
loss of PTHR selectively in fat tissues blocks fat and muscle
tion in fat tissues attenuated wasting of both adipose tissue and
wasting in both CKD and cancer cachexia models. Because
skeletal muscle without changing average tumor mass (Figures
loss of PTHR in fat tissue also improves muscle mass and
7B and 7C). Histological examination of these tissues showed
strength, these data argue that there must be indirect
4 Cell Metabolism 23, 1–9, February 9, 2016 ª2016 Elsevier Inc.
Please cite this article in press as: Kir et al., PTH/PTHrP Receptor Mediates Cachexia in Models of Kidney Failure and Cancer, Cell Metabolism (2016),http://dx.doi.org/10.1016/j.cmet.2015.11.003
patients correlates with increased mortality and cardiovasculardisease (Neyra et al., 2003; Wang et al., 2004). Interestingly, pa-tients undergoing dialysis with hyperparathyroidism were shownto have increased resting energy expenditure that may be reducedafter parathyroidectomy (Cuppari et al., 2004). Increased Ucp1expression in brown fat was previously implicated in the weightloss of 5/6 nephrectomized mice (Cheung et al., 2007, 2014).
Our findings support the involvement of adipose tissue thermo-genesis in this cachexia model and identify PTH as an importantdriver of thermogenesis and hypermetabolism. As shown above,PTH treatment potently induces thermogenic genes in fat tissueof mice. Furthermore, primary hyperparathyroidism in humans,although not associated with cachexia, led to increased expres-sion of thermogenic genes in deep cervical fat, which possessessome characteristics of brown/beige fat tissue, including signifi-cant thermogenic capacity. Therefore, it is possible that second-ary hyperparathyroidism associated with CKD and other chronicdiseases in humans may lead to inappropriate thermogenesisand trigger wasting in the presence of other contributing factors.
Our findings also showed that the PTH/PTHrP pathway stimulatesexpression of a number of secreted factors in fat cells. Therefore,this pathway has multiple effects on the fat tissue, which maytrigger hypermetabolism and skeletal muscle atrophy. Furtherstudies are needed to establish a role for these other secreted fac-tors in PTH/PTHrP-driven muscle atrophy.
Finally, our work indicates that the PTH/PTHrP pathway is a
generally important player in cachexia and targeting thispathway may be useful in fighting cachexia. In fact, our earlierstudy showed that neutralization of PTHrP by a specific anti-body blocks tumor-driven cachexia (Kir et al., 2014). It will beinteresting to test if similar approaches may be beneficialagainst CKD-driven cachexia. Unlike PTHrP, PTH is alsoinvolved in regulation of mineral metabolism. Therefore, thera-peutic targeting of PTH or PTHR may be limited by their crucialroles in calcium and phosphate regulation.
EXPERIMENTAL PROCEDURES
ReagentsSynthetic mouse PTHrP(1–34), rat PTH(1–34), and rat PTH(1–84) were pur-chased from Bachem. Mouse intact PTH (1–84) ELISA assay kit was fromALPCO. Norepinephrine was purchased from Sigma. Total-ERK1/2 antibody(#9102) and anti-UCP1 (ab10983) were purchased from Cell Signaling and Ab-
Figure 4. PTH and PTHrP Are Unable to Induce Thermogenic Genes
cam, respectively.
in the Absence of PTHR(A) Primary adipocytes from wild-type and mutant cells were treated with
10 ng/ml PTHrP(1–34), 10 ng/ml PTH(1–34), or 10 nM Norepinephrine (NE) for
All animal experiments were approved by the Institutional Animal Care and
2 hr (n = 3).
Use Committee of the Beth Israel Deaconess Medical Center. In all studies,
(B–D) Mice received a single dose of PTHrP(1–34) (1 mg/kg body weight;
lean, 6- to 8-week-old, male, C57BL/6 mice were used. Pth1r-floxed mice
subcutaneously) and were killed 2 hr later (n = 5–6). Gene expression changes
were a gift from Dr. Henry Kronenberg (MGH) (Kobayashi et al., 2002).
were determined with RT-qPCR. Total UCP1 and ERK1/2 protein levels in
Pth1r-floxed mice (±Adiponectin-Cre) were maintained on a pure C57BL/6
inguinal fat tissue were measured with western blotting (D).
background. All other mice were obtained from Charles River Laboratories.
The values are mean ± SEM. *Differences compared to the control group.
Mice were maintained in 12 hr light/dark cycles (6 am to 6 pm) at 24!C and
#Differences between the WT and KO groups. *p < 0.05, ***p < 0.0005, #p <
fed standard irradiated rodent chow diet; 5 million LLC cells per mouse
0.05, ##p < 0.005, ###p < 0.0005. See also Figure S3.
were injected subcutaneously over the flank. Non-tumor-bearing controlmice received the vehicle (PBS) only. Mice received subcutaneous injections
mechanisms (involving PTHR function in fat tissue) through which
of PTHrP and PTH peptides and all mice were killed between 4 pm and 7 pm.
Plasma was collected into EDTA tubes for the PTH ELISA assay. Heparin
pathological signals go from fat to skeletal muscle.
tubes were used to collect plasma for BUN measurements, which were per-
Chronic kidney failure is a very complex disease. Although
formed with a Vitros analyzer. Whole-body energy metabolism was evaluated
malnutrition or various comorbid events may contribute to weight
using a Comprehensive Lab Animal Monitoring System (CLAMS, Columbia In-
loss in patients with CKD, increased energy expenditure in certain
struments). Mice were put into metabolic cages between post-surgery weeks
Cell Metabolism 23, 1–9, February 9, 2016 ª2016 Elsevier Inc. 5
Please cite this article in press as: Kir et al., PTH/PTHrP Receptor Mediates Cachexia in Models of Kidney Failure and Cancer, Cell Metabolism (2016),http://dx.doi.org/10.1016/j.cmet.2015.11.003
Figure 5. Adipo-PTHR-KO Mice Are Resis-tant to 5/6 Nephrectomy-Driven Cachexia(A–F) Mice underwent sham or 5/6 nephrectomy(5/6 Nx) surgery and were killed 5 weeks later (n = 5–6). Blood Urea Nitrogen (BUN) (A) and plasma PTH(B) levels were measured. Mice were placed intometabolic cages between post-surgery weeks 2and 3, when the difference in body weight wassmall. Oxygen consumption (VO2) (C), physical ac-tivity (D), and body weight (E) were monitored. Fatand muscle tissues were dissected and weighed (F).
The values are mean ± SEM. *Differences betweenthe sham and 5/6 Nx groups. #Differences betweenthe WT-5/6 Nx and KO-5/6 Nx groups. *p < 0.05,**p < 0.005, ***p < 0.0005, #p < 0.05. See also Fig-ure S4.
tissue was filtered through a 100-mm cell strainer andcentrifuged at 600 3 g for 5 min to pellet the SV cells.
These were then resuspended in adipocyte culturemedium (DMEM/F12 plus glutamax [1:1; Invitrogen],pen/strep, and 10% FBS), filtered through a 40-mmcell strainer, centrifuged as above, resuspended inadipocyte culture medium and plated. The SV cellswere grown to confluency for differentiation, whichwas induced by the adipogenic cocktail containing1 mM dexamethasone, 5 mg/ml insulin, 0.5 mM isobu-tylmethylxanthine (DMI), and 1 mM rosiglitazone inadipocyte culture medium. Two days after induction,cells were maintained in adipocyte culture mediumcontaining 5 mg/ml insulin and 1 mM rosiglitazone.
2 and 3 (and killed at week 5), when the difference in body weight between the
Starting at day 6, cells were maintained in adipocyte culture medium only and
sham and 5/6 nephrectomy groups was small. CO2 and O2 data were
treated with PTHrP and PTH peptides for 2 hr and harvested at day 8.
collected every 32 min for each mouse and were normalized to total bodyweight. Data on activity, heat generation, and food intake were measured at
more frequent intervals. For H&E staining, tissues were fixed in 10% formalin,
RNA was extracted from cultured cells or frozen tissue samples using TRIzol
embedded in paraffin, and cut into 6-mm sections on slides. Whole body fat
(Invitrogen), purified with QIAGEN RNeasy minicolumns, and reverse-tran-
composition was determined using an EchoMRI analyzer.
scribed using High Capacity cDNA Reverse Transcription kit (Applied Bio-systems). Resulting cDNA was analyzed by qPCR using SYBR GreenER PCR
Master Mix (Invitrogen). Reactions were performed in 384-well format using
This procedure involves removing one kidney and two-thirds of the other kid-
an ABI PRISM 7900HT instrument (Applied Biosystems). Relative mRNA levels
ney. The surgery was performed in two phases. The mouse was first anesthe-
were calculated using the comparative CT method and normalized to cyclophi-
tized with isoflurane (inhaled 1%). An incision was made on the right lateral to
lin mRNA. The sequence information of the mouse primer sets were published
the spine. The kidney was freed from the surrounding tissue and then decap-
previously (Kir et al., 2014). Sequence information of human primers is:
sulated to preserve the adrenal gland. The upper and lower poles of the kidney
cyclophilin F: 50-GGAGATGGCACAGGAGGAA-30, R: 50-GCCCGTAGTGC
were partially resected, leaving one-third of the kidney. Bleeding was
TTCAGTTT-30; UCP1 F: 50-GCAGGGAAAGAAACAGCACCT-30, R: 50-ACTTT
controlled with electrocautery. The abdomen was closed with sutures and
CACGACCTCTGTGGG-30; DIO2 F: 50-ATGCTGACCTCAGAGGGACT-30, R:
wound clips. After 1 week of recovery, the same preparations were made on
50-ATCCTCACCCAATTTCACCTGT-30; PGC1A F: 50-CCTGCATGAGTGTGTG
the left side as for the right side. The renal blood vessels and ureter were
CTCT-30, R: 50-CAGCACACTCGATGTCACTCC-30; CIDEA F: 50-GGAGCTCA
cauterized and the kidney was removed by transecting the vessels and ureter.
TCAGCAAGACTCTG-30, R: 50-AACTCTTCTGTGTCCACCACG-30; LHX8 F:
The incision was closed with sutures and wound clips. Control mice received
sham operations, which included kidney decapsulation but not removal. Bu-
LEP F: 50-GGAACCCTGTGCGGATTCTT-30, R: 50-GGAGGAGACTGACTGCG
prenorphine was used as the analgesic for 2 days post-surgeries.
TG-30; SHOX2 F: 50-AGGCTTTTTGACGAGACCCA-30, R: 50-AAACCAAACCTGCACTCGGG-30.
Grip StrengthForelimb grip strength was assessed on the same day that the mice were
killed. Each mouse was allowed to grab a bar attached to a force transducer
Affymetrix mouse genome 430 v2.0 arrays were used to generate expression
(Model DFX II; Chatillon) as it was pulled by the tail horizontally away from
profile data, which were analyzed using dChip software.
the bar (Cabe et al., 1978).
Frozen tissues were homogenized in a lysis buffer containing 50 mM Tris (pH
Inguinal stromal-vascular (SV) fractions were obtained from 30- to 35-day-old
7.4), 500 mM NaCl, 1% NP40, 20% glycerol, 5 mM EDTA, and 1 mM PMSF,
male mice by the following procedure. Inguinal fat tissue was dissected, washed
supplemented with protease and phosphatase inhibitor cocktails (Roche).
with PBS, minced, and digested for 45 min at 37!C in PBS containing 10 mM
The homogenates were centrifuged at 13,000 rpm for 10 min and the super-
CaCl, 2.4 U/ml dispase II (Roche), and 1.5 U/ml collagenase D (Roche). Digested
natants were used as whole cell lysates. Protein concentration was
6 Cell Metabolism 23, 1–9, February 9, 2016 ª2016 Elsevier Inc.
Please cite this article in press as: Kir et al., PTH/PTHrP Receptor Mediates Cachexia in Models of Kidney Failure and Cancer, Cell Metabolism (2016),http://dx.doi.org/10.1016/j.cmet.2015.11.003
Figure 6. Adipose Tissue Browning and Skeletal Muscle Atrophy Are Suppressed in 5/6 Nephrectomized Adipo-PTHR-KO Mice(A–F) Mice underwent sham or 5/6 nephrectomy (5/6 Nx) surgery (n = 5-6). H&E staining of adipose tissues and gastrocnemius muscle were shown (A). mRNAlevels in iWAT (B), iBAT (C) and gastrocnemius muscle (F) were measured by RT-qPCR. Total UCP1 and ERK1/2 protein levels in inguinal fat tissue weredetermined by western blotting (D). Muscle function was analyzed by grip strength (E).
The values are mean ± SEM. *Differences between the sham and 5/6 Nx groups. #Differences between the WT-5/6 Nx and KO-5/6 Nx groups. *p < 0.05, #p < 0.05,###p < 0.0005. See also Figure S5.
determined by Bio-Rad Protein assay and 30 mg of protein lysate was used in
Patients with thyroid and parathyroid cancer were excluded from our cohort.
each SDS-PAGE run. PVDF membrane was blotted with antibodies in TBS
Subjects were not excluded based on sex, ethnicity, or other demographics.
containing 0.05% Tween and 5% BSA. For secondary antibody incubation,TBS-T containing 5% milk was used. ECL western blotting substrates from
Statistical Analysis
Pierce were used for demonstration of the results.
Values are expressed as mean ± SEM. Significant analysis was performed us-ing two-tailed, unpaired t test for single variables and two-way ANOVA followed
by Bonferonni post-tests for multiple variables. Two-way ANOVA with repeated
This study was approved by the Human Studies Institutional Review Board of the
measures was used when analyzing body weight and metabolic data such as
Massachusetts General Hospital (MGH). Individuals who were scheduled to un-
oxygen comsumption (VO2), carbon dioxide consumption (VCO2), physical ac-
dergo neck surgery at MGH were identified by K.P.E. and W.L. and written
tivity, and heat output. Graphpad Prism software was used for ANOVA analysis.
informed consent was obtained by K.P.E. and W.L. before surgeries.
Subcutaneous and deep cervical fat samples were collected from patients un-dergoing parathyroidectomy for PHPT. The control group samples were
ACCESSION NUMBERS
collected from patients undergoing thyroidectomy for benign pathologies (i.e.,Graves disease, benign goiter and Hurtle-cell neoplasm). Samples collected
The accession number for the microarray dataset reported in this paper is
included excess fat tissue that was resected as part of the surgical procedure.
GEO: GSE74082.
Cell Metabolism 23, 1–9, February 9, 2016 ª2016 Elsevier Inc. 7
Please cite this article in press as: Kir et al., PTH/PTHrP Receptor Mediates Cachexia in Models of Kidney Failure and Cancer, Cell Metabolism (2016),http://dx.doi.org/10.1016/j.cmet.2015.11.003
Figure 7. Adipo-PTHR-KO Mice Are Resistant to LLC Tumor-Driven Cachexia(A–D) Mice inoculated with LLC cells were killed 16 days later (n = 6). Carcass weight (calculated by subtracting tumor weight from the total weight) (A) and tumorweight (B) are shown. Fat and muscle tissues were dissected and weighed (C). H&E staining of adipose tissues and gastrocnemius muscle is shown (D).
(E–G) Mice inoculated with LLC cells were killed 14 days later (n = 4–5). mRNA levels in iWAT (E) and iBAT (F) were measured with RT-qPCR. Total UCP1 andERK1/2 protein levels in inguinal fat tissue were determined by western blotting (G).
(H and I) Mice inoculated with LLC cells were killed 16 days later (n = 6). Muscle function was analyzed by grip strength (G). mRNA levels in gastrocnemius muscle(H) were measured with RT-qPCR.
The values are mean ± SEM. *Differences between the LLC and non-tumor-bearing groups. #Differences between the WT-LLC and KO-LLC groups. *p < 0.05,**p < 0.005, ***p < 0.0005, #p < 0.05, ##p < 0.005, ###p < 0.0005. See also Figure S6.
8 Cell Metabolism 23, 1–9, February 9, 2016 ª2016 Elsevier Inc.
Please cite this article in press as: Kir et al., PTH/PTHrP Receptor Mediates Cachexia in Models of Kidney Failure and Cancer, Cell Metabolism (2016),http://dx.doi.org/10.1016/j.cmet.2015.11.003
SUPPLEMENTAL INFORMATION
Supplemental Information includes six figures and one table and can be found
with this article online at
S.K. is a Robert Black Fellow of the Damon Runyon Cancer Research Founda-
tion (DRG-2153-13). H.K. is a JSPS Postdoctoral Fellow for Research Abroad.
This work was supported by grants from the NIH (DK31405) and the JPB Foun-
dation (to B.M.S.) and NIH grant (DK097105 to B.L.).
Received: July 20, 2015Revised: September 25, 2015
Accepted: November 4, 2015
Published: December 3, 2015
Cell Metabolism 23, 1–9, February 9, 2016 ª2016 Elsevier Inc. 9
Source: http://u-tokai-nem.jp/kenkyu/img/PTH%20Cachexia.pdf
Hipotiroidismo canino Autor: Porfirio Trápala Arias.Médico Veterinario en Ciencias VeterinariasDiplomado en Dermatología VeterinariaCatedratico de la Materia de Clínica de Perrose Inmunología en C.E.U.Practica Privada Clinica Veterinaria "Alhaurín"Monterrey, N.L. México. (81) 84009813 y 85Email: [email protected] El hipotiroidismo se define como la falta de secrección o de
International Journal of Pharmaceutics 186 (1999) 119 – 125 A compartmental absorption and transit model for estimating oral drug absorption Lawrence X. Yu a,*, Gordon L. Amidon b a Glaxo Wellcome Inc., Fi6e Moore Dri6e, Research Triangle Park, NC 27709, USA b College of Pharmacy, The Uni6ersity of Michigan, Ann Arbor, MI 48109, USA