Microsoft word - 2012 first application of axial speed of sound to follow up injured equine tendons reprint.doc
Ultrasound in Medicine & Biology (38), 2012. http://dx.doi.org/10.1016/j.ultrasmedbio.2011.10.008
FIRST APPLICATION OF AXIAL SPEED OF SOUND
TO FOLLOW UP INJURED EQUINE TENDONS
Claudio Vergari*,†, Philippe Pourcelot†, Bérangère Ravary-Plumioën†, Anne-Gaelle Dupays†,‡,
Jean-Marie Denoix†,‡, David Mitton§, Pascal Laugier# and Nathalie Crevier Denoix†
Ultrasonography is an established technique to follow up injured tendons,
although the lesions' echogenicity tends to become normal before the tendon is ready to sustain the stresses imposed by exercise. Normalized axial speed of sound (SOS) has been found to correlate with an injured tendon's stiffness; therefore, the purpose of this study was to establish whether SOS would be a useful tool in tendon injury follow-up. Axial SOS was measured in 11 equine superficial digital flexor tendons during a 15 weeks follow-up period, and compared with an ultrasonographic grading system. SOS significantly decreased 2 weeks after the surgical induction of a core lesion, showing a minimum between 7 and 10 weeks; ultrasonographic grade showed a minimum at 3 weeks and increased thereafter. The ultrasonographic grading at 15 weeks was correlated to normalized SOS. These results suggest that axial SOS provides complementary information to ultrasonography that could be of clinical interest.
Keywords: Soft tissue; Tendon; Injury; Quantitative ultrasound; Speed of sound; Ultrasonography.
† Université Paris Est, Ecole Nationale Vétérinaire d'Alfort, USC 957 BPLC, F-94700 Maisons-Alfort, France ; INRA, USC 957 BPLC, F-94700 Maisons-Alfort, France.
‡ Université Paris Est, Ecole Nationale Vétérinaire d'Alfort, CIRALE, F-14430 Goustranville, France § Université de Lyon, F-69622, Lyon, France; IFSTTAR, LBMC, UMR_T9406, F-69675, Bron ; Université Lyon 1, Villeurbanne. # UPMC Université Paris 6, UMR CNRS7623, LIP, Paris, F 75005 France. *Corresponding author:
[email protected] (C.Vergari)
Ultrasound in Medicine & Biology (38), 2012. http://dx.doi.org/10.1016/j.ultrasmedbio.2011.10.008
tendon SOS). However, the progression of SOS
during the 3.5 months follow-up was not reported in this previous study, and the clinical
Tendon lesions are the most investigated and
relevance of this technique has not been
most common equine musculoskeletal injuries
investigated yet.
(Thorpe et al. 2010); they present a high rate of
The objectives of the present study were (i) to
recurrence and their outcome is often negative
report the axial SOS measured during a 15
(Dyson 2004; Marr et al. 1993; van den Belt et
weeks follow-up of 11 injured tendons, (ii) to
al. 1994). Training and competing are both
compare these SOS values with the semi-
responsible of these injuries (Ely et al. 2004;
quantitative ultrasonographic assessment of the
Murray et al. 2006; Pinchbeck et al. 2004). They
same tendon lesions made by clinicians and (iii)
often require long periods without full training
to verify if SOS could provide complementary
and they represent one of the major reasons of
information for the evaluation of tendon status.
horse athletes retirement (Lam et al. 2007). Ultrasonography is a widely spread technique
2. Materials and methods
for tendon lesions diagnosis, follow-up and a tool to establish a prognosis (Denoix et al. 1990; Genovese et al. 1986). Although qualitative in
2.1 Subjects and timing
Eleven French Trotters (2-4 years old) were
ultrasonographic images of a tendon lesion (e.g.
included in the present study. They were
size, echogenicity and architecture) can be semi-
participating in a clinical trial testing the
quantitatively assessed by grading (Genovese et
efficiency of a regenerating agent on SDFT
al. 1990; van den Belt et al. 1993). This
lesions. Six horses were thus bilaterally treated
operator-dependant technique relies on the
with this molecule, while a placebo was
clinician's experience; this aspect is critical
administered to the other 5. The evaluation of
during the follow-up, when the echogenicity of
this molecule, however, is beyond the scope of
healing tendons progressively increases up to its
the present paper.
normal level (Fig. 1). In order to stimulate
The trial (approved by the Ethical Committee
collagen production and optimize fibres
ComEth Afssa/Ecole Nationale Vétérinaire
alignment (Alves et al. 2001; Kingma et al. 2007)
d'Alfort/Université Paris-Est Créteil) required
without applying unnecessary stresses to a still
the bilateral surgical induction (SI) of a tendon
fragile tendon, a reliable prognosis is required to
core lesion in the middle metacarpal area of the
determine the most appropriate time to start
forelimb SDFT. The lesion was induced with a
controlled exercise and its intensity (Dowling et
specially designed amagnetic pin, 30 cm long
al. 2000; Gillis 1997).
and ending with a 4 edged arrowhead of 10 mm,
Quantitative ultrasound is being applied to non-
using a previously described surgical technique
invasively evaluate tendon load (Crevier-Denoix
(Schramme et al. 2010; Vergari et al. In Press).
et al. 2009; Pourcelot et al. 2005; Roux and
The lesions were about 7 cm in length and
included about half of the tendon cross-section.
demonstrated that axial speed of sound (SOS) in
Ultrasonographic images of the SDFT were
tendon varies with the tendon loading
acquired before the SI and 3, 7, 10 and 15 weeks
(Pourcelot et al. 2005). Recently, SOS has been
after it (subscripts from 0 to 4). Axial tendon
measured in healthy equine superficial flexor
SOS was measured before SI and 2, 7, 10 and
tendons (SDFT) and 3.5 months after the
15 weeks after it (subscripts from 0 to 4).
induction of a core tendon lesion (Vergari et al.
Horses were weighted before the SI (437 ± 27
In Press). SOS significantly decreased after the
kg average body mass) and 15 weeks after it
induction and, while SOS values were not
(437 ± 28 kg), finding a non-significant
correlated to injured tendon's elastic modulus, a
correlation was observed between the latter and
normalized SOS (the ratio of injured on normal
Ultrasound in Medicine & Biology (38), 2012. http://dx.doi.org/10.1016/j.ultrasmedbio.2011.10.008
2.2 Ultrasonographic images
ultrasonographic grade (UG) from 0 for normal tendon to 10 for maximal lesion severity,
Trained clinicians acquired ultrasonographic
according to: UG = 10 – score*10/16. Each
images (with an Aloka Alpha-10 Prosound,
tendon was independently graded at each stage
using a 7.5 MHz linear probe with a standoff
(UG to UG ). A reduced ultrasonographic
pad) of both forelimbs SDFT of each horse in
grade (RUG) was also calculated by summing
the metacarpal area. Both longitudinal (with the
and normalizing only the two scores relative to
ultrasound beam parallel to the tendon fibres)
the lesion's echogenicity and transversal
and transverse images (with the ultrasound
architecture (RUG = 10 – score*10/8).
beam perpendicular to the tendon fibres) were acquired. The ultrasonographic machine's
2.4 Speed of sound measurements
magnification, contrast and luminosity were standardised, while for each image the gain was
SOS in the right SDFT of each horse was
adapted, in order to optimize the brightness of
measured with a previously described technique
the SDFT, and the focus was placed in the
(Pourcelot et al. 2005) and protocol (Crevier-
middle of the lesion.
Denoix et al. 2009; Vergari et al. In Press). The
The ultrasonographic examinations included the
probe was composed by a 1 MHz broadband
entire metacarpal area, where the lesions were
pulse emitter and two receivers, which are 1 cm
targeted. Three weeks after the SI, a region of
spaced. The received ultrasonic signals (400 per
interest (ROI) for a given horse was defined as
second) were digitized at 10 MHz and the time
the tendon cross-section where the maximal
of flight of the first arriving signal was estimated
lesion severity was observed.
using the first zero crossing criterion (Bossy et al. 2002); the speed of this first arriving signal
2.3 Ultrasonographic scoring
was calculated as the distance between the two receivers divided by the corresponding signal
Different ultrasonographic scoring systems have
time-of-flight difference.
been previously used to semi-quantitatively
SOS measurements were performed during 6
evaluate injured tendons in veterinary practice
series of walk (about 5 strides each) on an
(Genovese et al. 1986; Saini et al. 2002; Van den
asphalt pavement. The maximal SOS value
Belt et al. 1993). In the present study, four semi-
measured in each stride, corresponding to the
quantitative ultrasonographic criteria were
tendon's maximal load, was selected, then these
defined (score 0 – 4): a. lesion echogenicity (0
maximal values were averaged to obtain the
mean maximal SOS. This quantity was
anechogenic tissue), b. transversal lesion extent
measured before the SI (SOS ) and 2, 7, 10 and
(0 no extension - 4 lesion area > 50% of the
15 weeks after it (SOS to SOS ). SOS was
cross-sectional area), c. transversal lesion
measured in the middle palmar metacarpal area
architecture (0 normal - 4 pathologic
(the expected location of the lesion) while SOS
hypoechogenic tissue) and d. longitudinal lesion
through SOS were measured in the ROI.
architecture (0 sane tendon - 4 complete
Considering SOS variability among sane
disorganization of fibres pattern). Criteria a to c
tendons (Crevier-Denoix et al. 2009) and the
were defined on the images corresponding to
influence of the initial severity of the lesion on
the ROI. Although a score was assigned to each
its evolution, two normalized values of SOS
ultrasonographic criterion on each examination,
were calculated to quantify the impact of the
the definitive scoring was reassessed for each
lesions on SOS: SOS / SOS (i.e. relative to
horse during a longitudinal blind collegial review
the SOS in normal tendon) and SOS / SOS
of all images. The clinicians who examined the
(i.e. relative to the SOS measured in the recently
ultrasonographic images did not have access to
injured tendon).
the SOS measured values. The four scores were summed (yielding scores from 0 to 16) and normalized to give a final
Ultrasound in Medicine & Biology (38), 2012. http://dx.doi.org/10.1016/j.ultrasmedbio.2011.10.008
2.5 Statistical analysis
UG were significantly lower. The grade was at
its lowest 3 weeks after the SI (average UG =
Normality was tested with the Lilliefors test.
1.6 ± 0.7). It started increasing thereafter up to
Pearson's correlation coefficient was calculated
half of its original value (UG = 5.2 ± 0.6) 15
for normally distributed variables while
weeks after the SI (Fig. 2). Horses #5 and #9
Spearman's rank correlation coefficient was
were the only two horses whose grade remained
used for the non-normally distributed ones.
constant between 3 and 7 weeks (UG = 2.5 and
Differences between measurements at different
3.1, respectively). Average UG in each
stages were statistically analyzed with Wilcoxon
measurement session was significantly different
signed-rank test. Significance level was set at p
from the previous one. RUG presented a similar
variation in time (i.e. a minimum 3 weeks after
The short term precision of the SOS
the SI followed by a steady increase), but
measurement, as defined by Gluer et al. (1995),
showed a higher range of variation (from RUG
was calculated separately for each stage. For this
= 0.9 ± 1.0 to RUG = 6.1 ± 0.9).
precision evaluation, it was considered that the average of each series of walk (about 5 strides
3.2 Speed of sound
each) corresponded to one SOS measurement; thus, SOS measurement was repeated 6 times
Table 1 reports the average SOS of each
for each horse and each exam.
measurement session. Averaged SOS in healthy tendons was 2178.8 ± 32.8 m/s (before SI).
SOS significantly decreased after two weeks (2096.6 ± 49.7 m/s) and seven weeks (2041.8 ± 62.6 m/s) after SI. Then, a stabilization was
3.1 Ultrasonographic grade
observed from week 7 to 10 after SI (2041.5 ± 67.5 m/s). Finally, a significant increase was
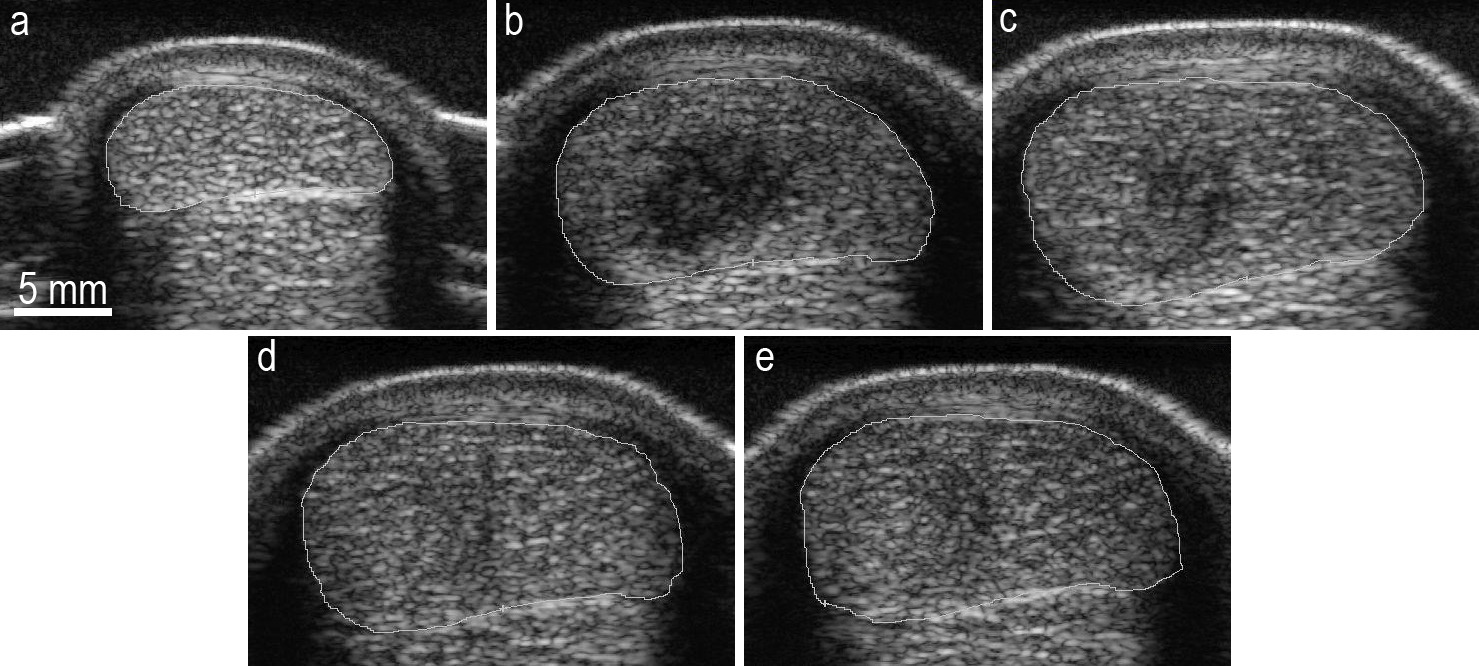
Figure 1 shows an example of transverse
measured at week 15 after SI (2072.4 ± 66.2
ultrasonographic images in normal tendon and
m/s, Fig. 2). While at the end of the study no
during its lesion follow up. Table 1 reports the
tendon had regained its initial SOS, two tendons
average value for each variable and each exam.
(#3 and #10) reached similar or higher SOS
UG was 10 for all horses (since all the tendons
values than those measured 2 weeks after SI.
were initially healthy), while grades from UG to
Figure 1. Transverse ultrasonographic images of tendon #5, acquired in normal tendon (a), 2 (b), 7 (c), 10 (d) and 15 weeks (e) after the surgical induction of a core lesion.
Ultrasound in Medicine & Biology (38), 2012. http://dx.doi.org/10.1016/j.ultrasmedbio.2011.10.008
Table 1. Ultrasonographic evaluation and speed of sound measured before and during the injured tendons' follow-up
UG: ultrasonographic clinical grade; RUG: reduced ultrasonographic clinical grade; SOS: speed of sound.
The short term precision of the technique for
each stage was inferior or equal to 0.3 %
ultrasonographic grades, but SOS /SOS and
(corresponding to about 6 m/s).
SOS /SOS were both correlated to UG (Table
2). The ratios SOS /SOS and SOS /SOS were
also significantly correlated both to UG (r =
0.72, p = 0.01) and RUG (r = 0.63, p = 0.04).
UG was found correlated to several SOS
However, the ratio SOS /SOS was not
relative variations (Table 2); in particular, the
correlated to the clinical ultrasonographic grade.
best predictor of UG was SOS /SOS (r =
0.78, p = 0.005, Fig. 3). A similar correlation
was found when considering RUG (r = 0.79, p
= 0.004). SOS values at other stages were not
This study represents the first application of axial SOS in the monitoring of surgically
induced tendon lesions. SOS was compared with the ultrasonographic assessment all along the tendons healing process, performed by trained clinicians. Six horses were bilaterally treated with a regenerating agent, while the other 5 were bilaterally administered a placebo; the evaluation of this regenerating agent, however, was beyond the scope of the present paper. The precision error of the technique was found lower than 6 m/s at all stages; Crevier-Denoix et al. (2009) previously evaluated the precision of SOS measurements in normal tendons during in-vitro tension cycling, finding an error inferior to 1 m/s for loads between 600
and 4050 N (the loads expected at walk being in this range). Although six times higher than the
error found in vitro, the precision error evaluated
ultrasonographic
in this study was still below 0.3%; the difference
measured 15 weeks after lesion induction) and
is likely due to the variability of in-vivo dynamic
the speed of sound (SOS) measured 7 (black
(i.e. at walk) measurements contrary to
dots) and 15 weeks (gray dots) after lesion
controlled laboratory testing.
induction, both normalized on the initial speed
SOS is clearly showing an important
of sound, in 11 equine superficial digital flexor
interindividual variability (Crevier-Denoix et al.
2009), most likely because of the different
Ultrasound in Medicine & Biology (38), 2012. http://dx.doi.org/10.1016/j.ultrasmedbio.2011.10.008
Table 2. Correlation coefficient describing the relation of normalized speed of sound values with the ultrasonographic clinical grade and reduced clinical grade († p < 0.05; ‡ p < 0.01).
SOS: speed of sound; UG: ultrasonographic clinical grade; RUG: reduced ultrasonographic clinical grade; subscript 0: measurements in normal tendon; subscripts from 1 to 4: measurements performed 2, 7, 10 and 15 weeks, respectively, after the surgical induction of core tendon lesions.
mechanical properties that affect ultrasound
should be investigated further before being
propagation (i.e. elastic modulus, density and
applied in the clinical context.
Poisson's ratio). Normalized SOS values were
The clinical grading by ultrasonography
expected to account for this variability and thus
evaluated four lesion features: echogenicity,
better reflect the effects induced by the tendon
transversal extent, transversal architecture and
injury, so it is not surprising that those values
longitudinal architecture. While normalized SOS
were significantly correlated with the clinical
values were in agreement with the clinical
assessment by ultrasonography. The correlation
assessment by ultrasonography at 15 weeks,
between SOS /SOS and UG suggests that
normalized SOS at a late stage (relatively to the
complementary information. In fact, the latter
present study) is capable of quantifying the
show a minimum between 7 and 10 weeks after
clinical ultrasonographic assessment, which
the induction, while the clinicians observed that
relies on the examiner's experience. Normalized
the ultrasonographic characteristics of the
SOS measured 7 and 10 weeks after induction
lesions started recovering from 3 weeks. This
were already correlated with this final clinical
difference between ultrasonographic evaluation
assessment, which was performed several weeks
and SOS might reflect two different aspects of
later, suggesting that normalized SOS values
the injured tendon; while the former evaluates
may be capable of predicting the tendon status a
its structure and architecture (i.e. lesion extent,
few weeks in advance. This result was
alignment of newly formed fibres), the latter is
unexpected and the predictive capacity of
related to tendon elastic modulus (Vergari et al.
normalized SOS values should be confirmed
In Press). Still, normalized SOS is probably
with a larger cohort and, possibly, on a longer
affected by the tendon's architecture, as
suggested by its correlation with the reduced
Values of SOS normalized on SOS offer an
ultrasonographic grade. In fact, the latter is
advantage on those normalized on SOS , since
based on the lesion's echogenicity (injured
in normal clinical practice a SOS reference of
tendon's mean echogenicity has been reported
normal tendon (i.e., before the lesion's
to be correlated to tendon's elastic modulus
insurgence) is rarely available; nevertheless, the
(Crevier-Denoix et al. 2005)), and transversal
lack of a significant correlation between
architecture; other combinations of grading
SOS SOS and UG casts doubts on the
were not correlated with normalized SOS.
relevance of this normalization. A reference for
Tendon healing can be divided in three or four
normal tendon SOS might be obtained in the
overlapping phases (Patterson-Kane and Firth
contralateral limb. However, as a SOS
2009; Sharma and Maffulli 2005). The first
difference of about 10 m/s between two normal
reaction to the injury, lasting about 4 days and
tendons coming from the same horse has been
often accompanied by haemorrhage, is an
previously reported (Crevier-Denoix et al.
inflammatory process characterised by swelling
2009), normalization on the contralateral limb
and infiltration of inflammatory cells, which after a few days are replaced by new blood
Ultrasound in Medicine & Biology (38), 2012. http://dx.doi.org/10.1016/j.ultrasmedbio.2011.10.008
vessels and fibroblasts. This early repair tissue is
gelatinous and contains randomly oriented fibres (Watkins et al. 1985). After 6 weeks, the
The present study did not last enough to
thoroughly test the ability of SOS measurements
maturation) commences and, between 8 and 12
to help in the establishment of a reliable
weeks, the newly-produced collagen fibres start
prognosis of tendon lesions. Moreover, the
aligning along the stress direction. Ten weeks
tested lesions were not spontaneous, and the
after the injury, the fibrous tissue is gradually
sample was too small to positively define
substituted by scar-like tendon tissue. The SOS
technique's power to characterise them. Still, it
in injured tendon seems to roughly follow these
was observed that SOS is affected both by the
phases, with a decrease that begins with the
presence of a lesion and by its evolution in time,
injury occurrence and continues until the
and that SOS variations (i.e., the normalized
beginning of the remodelling phase. A
values) are related to the lesion status as
significant SOS increase was then observed
assessed by trained clinicians. While the
during the supposed formation of scar tissue
functional meaning of axial SOS has yet to be
(after 10 weeks from induction). The follow up
investigated, the presented results suggest that
ended 15 weeks after the lesion induction, so it
SOS measurements, as indicative of tendon's
is not known how the SOS would have changed
later; however, since the mechanical properties
information to the ultrasonographic exam.
of healed tendons rarely match their original
These results confirm the potential clinical
quality (Crevier-Denoix et al. 1997), it can be
interest of axial SOS measurements in the
supposed that eventually SOS would have not
follow-up of tendon lesions.
regained its original value. It can be hypothesized that the SOS decrease
Conflict of interest statement
observed during the first weeks was due to the swelling induced by the inflammatory state and
The authors have no conflicts of interest to
to the decreased injured tendon's elastic
modulus (Crevier-Denoix et al., 1997). The SOS increase observed between 10 and 15 weeks
probably coincided with the beginning of the fibres realignment. Numerical simulations could
The authors are grateful to the Direction
be used to assess the factors affecting the SOS
Générale de l'Enseignement et de la Recherche
progression in healing tendon, as it was recently
(French Ministry of Agriculture), the Région
done for healing bones (Machado et al., 2010).
Basse-Normandie, the Institut National de la
However, this would require more information
Recherche Agronomique and the Agence
on the mechanical and acoustic local properties
Nationale de la Recherche (Programme ANR-
of injured tendon.
08-BIOT-021 RGTAtendon) for financial support. The authors would also like to thank Elodie Paumier-André for her precious help.
Ultrasound in Medicine & Biology (38), 2012. http://dx.doi.org/10.1016/j.ultrasmedbio.2011.10.008
Alves ALG, Rodrigues MAM, Aguiar AJA, Thomassian A, Nicoletti JLM, Hussni CA, Borges AS,
Effects of beta-aminopropionitrile fumarate and exercise on equine tendon healing: Gross and histological aspects. J Equine Vet Sci 2001;21:335-40.
Bossy E, Talmant M, Laugier P, Effect of bone cortical thickness on velocity measurements using
ultrasonic axial transmission: A 2D simulation study. J Acoust Soc Am 2002;112:297-307.
Crevier-Denoix N, Collobert C, Pourcelot P, Denoix JM, Sanaa M, Geiger D, Bernard N, Ribot X,
Bortolussi C, Bousseau B, Mechanical properties of pathological equine superficial digital flexor tendons. Equine Vet J Suppl. 1997:23-6.
Crevier-Denoix N, Pourcelot P, Ravary B, Robin D, Falala S, Uzel S, Grison AC, Valette JP, Denoix
JM, Chateau H, Influence of track surface on the equine superficial digital flexor tendon loading in two horses at high speed trot. Equine Vet J 2009;41:257-61.
Crevier-Denoix N, Ravary-Plumioën B, Evrard D, Pourcelot P, Reproducibility of a non-invasive
ultrasonic technique of tendon force measurement, determined in vitro in equine superficial digital flexor tendons. J Biomech 2009;42:2210-13.
Crevier-Denoix N, Ruel Y, Dardillat C, Jerbi H, Sanaa M, Collobert-Laugier C, Ribot X, Denoix JM,
Pourcelot P, Correlations between mean echogenicity and material properties of normal and diseased equine superficial digital flexor tendons: an in vitro segmental approach. J Biomech 2005;38:2212-20.
Denoix JM, Mialot M, Levy I, Lagadic M, Ultrasonography of tendons: histo-pathological study of
lesions correlated with abnormal ultrasonographic findings in the horse tendons and ligaments. Recl Med Vet 1990;166:45-55.
Dowling BA, Dart AJ, Hodgson DR, Smith RK, Superficial digital flexor tendonitis in the horse.
Equine Vet J 2000;32:369-78.
Dyson SJ, Medical management of superficial digital flexor tendonitis: a comparative study in 219
horses (1992-2000). Equine Vet J 2004;36:415-9.
Ely ER, Verheyen KL, Wood JL, Fractures and tendon injuries in National Hunt horses in training
in the UK: a pilot study. Equine Vet J 2004;36:365-7.
Genovese RL, Rantanen NW, Hauser ML, Simpson BS, Diagnostic ultrasonography of equine
limbs. Vet Clin North Am Equine Pract 1986;2:145-226.
Genovese RL, Rantanen NW, Simpson BS, Simpson DM, Clinical experience with quantitative
analysis of superficial digital flexor tendon injuries in Thoroughbred and Standardbred racehorses. Vet Clin North Am Equine Pract 1990;6:129-45.
Gillis CL, Rehabilitation of tendon and ligament injuries. P Annu Conv Am Equin 1997;43:306-09. Gluer CC, Blake G, Lu Y, Blunt BA, Jergas M, Genant HK, Accurate assessment of precision
errors: how to measure the reproducibility of bone densitometry techniques. Osteoporos Int 1995;5:262-70.
Kingma JJ, de Knikker R, Wittink HM, Takken T, Eccentric overload training in patients with
chronic Achilles tendinopathy: a systematic review. Br J Sports Med 2007;41:e3.
Lam KH, Parkin TD, Riggs CM, Morgan KL, Descriptive analysis of retirement of Thoroughbred
racehorses due to tendon injuries at the Hong Kong Jockey Club (1992-2004). Equine Vet J 2007;39:143-8.
Machado CB, de Albuquerque Pereira WC, Talmant M, Padilla F, Laugier P, Computational
evaluation of the compositional factors in fracture healing affecting ultrasound axial transmission measurements. Ultrasound Med Biol 2010;36:1314-26.
Marr CM, Love S, Boyd JS, McKellar Q, Factors affecting the clinical outcome of injuries to the
superficial digital flexor tendon in National Hunt and point-to-point racehorses. Vet Rec 1993;132:476-9.
Ultrasound in Medicine & Biology (38), 2012. http://dx.doi.org/10.1016/j.ultrasmedbio.2011.10.008
Murray RC, Dyson SJ, Tranquille C, Adams V, Association of type of sport and performance level
with anatomical site of orthopaedic injury diagnosis. Equine Vet J Suppl. 2006:411-6.
Patterson-Kane JC, Firth EC, The pathobiology of exercise-induced superficial digital flexor tendon
injury in Thoroughbred racehorses. Vet J 2009;181:79-89.
Pinchbeck GL, Clegg PD, Proudman CJ, Stirk A, Morgan KL, French NP, Horse injuries and racing
practices in National Hunt racehorses in the UK: the results of a prospective cohort study. Vet J 2004;167:45-52.
Pourcelot P, Defontaine M, Ravary B, Lematre M, Crevier-Denoix N, A non-invasive method of
tendon force measurement. J Biomech 2005;38:2124-9.
Pourcelot P, Van den Bogert AJ, Huang X, Crevier-Denoix N. Achilles and patellar tendon loading
during gait measured using a non-invasive ultrasonic technique. International Society of Biomechanics XXth Congress - ASB 29th Annual Meeting. Cleveland, Ohio, USA, 2005. p. 962.
Roux C, Defontaine M. Ultrasonic measurement of the human achilles tendon stress during loading:
preliminary experimental and theoretical results. Ultrasonics Symposium. Rotterdam: IEEE, 2005. pp. 1675-8.
Saini, N. S., Roy, K. S., Bansal, P. S., Singh, B., Simran, P. S., 2002. A preliminary study on the effect
of ultrasound therapy on the healing of surgically severed achilles tendons in five dogs. J Vet Med A Physiol Pathol Clin Med 49, 321-328.
Schramme M, Hunter S, Campbell N, Blikslager A, Smith R, A surgical tendonitis model in horses:
technique, clinical, ultrasonographic and histological characterisation. Vet Comp Orthop Traumatol 2010;23:231-9.
Sharma P, Maffulli N, Tendon injury and tendinopathy: healing and repair. J Bone Joint Surg Am
2005;87:187-202.
Thorpe CT, Clegg PD, Birch HL, A review of tendon injury: Why is the equine superficial digital
flexor tendon most at risk? Equine Vet J 2010;42:174-80.
van den Belt AJ, Becker CK, Dik KJ, Desmitis of the accessory ligament of the deep digital flexor
tendon in the horse: clinical and ultrasonographic features. A report of 24 cases. J Vet Med A 1993;40:492-500.
van den Belt AJ, Dik KJ, Barneveld A, Ultrasonographic evaluation and long-term follow-up of
flexor tendonitis/desmitis in the metacarpal/metatarsal region in Dutch warmblood horses and standardbred racehorses. Vet Q 1994;16 Suppl 2:S76-80.
Vergari C, Pourcelot P, Ravary-Plumioën B, Dupays AG, Jacquet S, Audigié F, Denoix JM, Laugier
P, Mitton D, Crevier-Denoix N, Axial Speed of Sound for the Monitoring of Injured Equine Tendons: a Preliminary Study. J Biomech 2012;45:53-8.
Watkins JP, Auer JA, Gay S, Morgan SJ, Healing of surgically created defects in the equine
superficial digital flexor tendon: collagen-type transformation and tissue morphologic reorganization. Am J Vet Res 1985;46:2091-6.
Source: http://www.vet-alfort.fr/automne_modules_files/pmedia/public/r1287_9_vergaric_ultrasmedbio2012v38.pdf
THANK YOU FOR DOWNLOADING THIS ETHICAL CONSUMER It contains a product guide complete with: • a detailed article• full rankings table • Best Buy advice• all the stories behind the marks on the table• company ownership and contact details• full list of references Subscribe to Ethical Consumer and get instant access to over
FDA Drug Safety Communication: FDA modifies monitoring for neutropenia associated with schizophrenia medicine clozapine; approves new shared REMS program for all clozapine medicines Safety Announcement [09-15-2015] The U.S. Food and Drug Administration (FDA) is making changes to the requirements for monitoring, prescribing, dispensing, and receiving the schizophrenia medicine clozapine, to address continuing safety concerns and current knowledge about a serious blood condition called severe neutropenia. Severe neutropenia is a dangerously low number of neutrophils, white blood cells that help fight infections. Severe neutropenia can be life-threatening. Treatment with clozapine may improve the symptoms of schizophrenia in patients who do not respond adequately to standard antipsychotic treatments. Symptoms of schizophrenia include hearing voices, seeing things that are not there, and being suspicious or withdrawn. Clozapine is also effective in reducing the risk of repeated suicidal behavior in patients with schizophrenia or schizoaffective disorder. We previously communicated safety information associated with clozapine i There are two parts to the changes in the requirements for treating patients with clozapine. First, we have clarified and enhanced the prescribing information for clozapine that explains how to monitor patients for neutropenia and manage clozapine treatment. Second, we approved a new, shared risk evaluation and mitigation strategy (REMS) called the Clozapine REMS Program. The revised prescribing information and the Clozapine REMS Program will improve monitoring and management of patients with severe neutropenia. The shared REMS is also expected to reduce the burden and possible confusion related to having separate registries for individual clozapine medicines. The requirements to monitor, prescribe, dispense, and receive all clozapine medicines are now incorporated into the Clozapine REMS Program. The Clozapine REMS Program replaces the six existing clozapine registries maintained by individual clozapine manufacturers. The shared REMS requires prescribers, pharmacies, and patients to enroll in a single centralized program. Patients who are currently treated with clozapine will be automatically transferred to the Clozapine REMS Program. In order to prescribe and dispense clozapine, prescribers and pharmacies will be required to be certified in the Clozapine REMS Program according to a specific transition schedule starting October 12, 2015 (see Additional Information for Prescribers section and Additional Information for Pharmacies section for more details). The monitoring recommendations for neutropenia caused by clozapine treatment have changed. Clozapine can decrease the number of neutrophils in the blood, in some cases causing severe